| Red | Green | Blue | |
| z | 17.64 | ||
| znorm | Inf | ||
| sky | -Inf | -NaN | -Inf |
| S/N | 27.7 | 49.9 | 52.8 |
| S/N(c) | 0.0 | 0.0 | 0.0 |
| SN(E/C) |
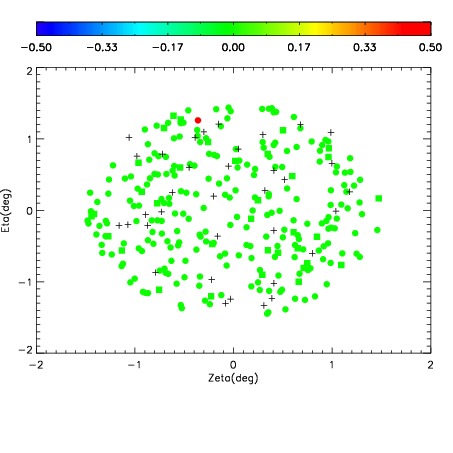
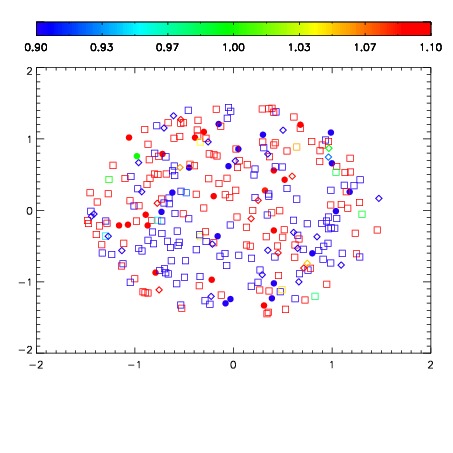
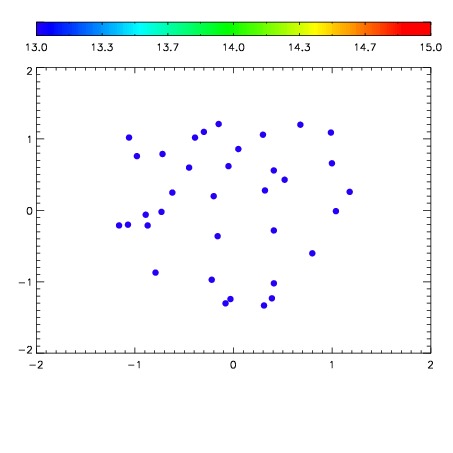

| Frame | Nreads | Zeropoints | Mag plots | Spatial mag deviation | Spatial sky 16325A emission deviations (filled: sky, open: star) | Spatial sky continuum emission | Spatial sky telluric CO2 absorption deviations (filled: H < 10) | |||||||||||||||||||||||
| 0 | 0 |
|
|
|
|
|
|
| IPAIR | NAME | SHIFT | NEWSHIFT | S/N | NAME | SHIFT | NEWSHIFT | S/N |
| 0 | 03130031 | 0.507987 | 0.00000 | 218.653 | 03130033 | 0.00108067 | 0.506906 | 218.635 |
| 1 | 03130035 | 0.507678 | 0.000309050 | 223.493 | 03130036 | -0.00122238 | 0.509209 | 228.428 |
| 2 | 03130034 | 0.506104 | 0.00188303 | 220.912 | 03130032 | 0.00376623 | 0.504221 | 221.481 |
| 3 | 03130030 | 0.504823 | 0.00316399 | 216.931 | 03130029 | 0.00000 | 0.507987 | 214.058 |