| Red | Green | Blue | |
| z | 17.64 | ||
| znorm | Inf | ||
| sky | -Inf | -Inf | -Inf |
| S/N | 21.5 | 38.8 | 45.9 |
| S/N(c) | 0.0 | 0.0 | 0.0 |
| SN(E/C) |
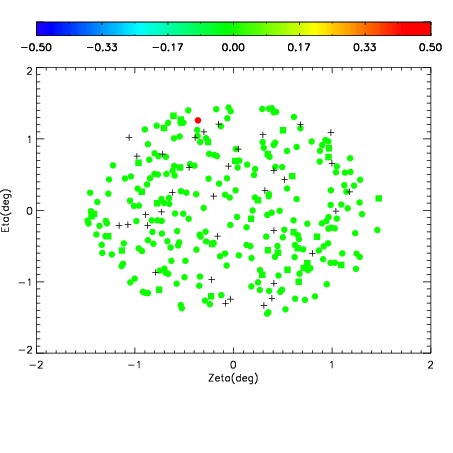
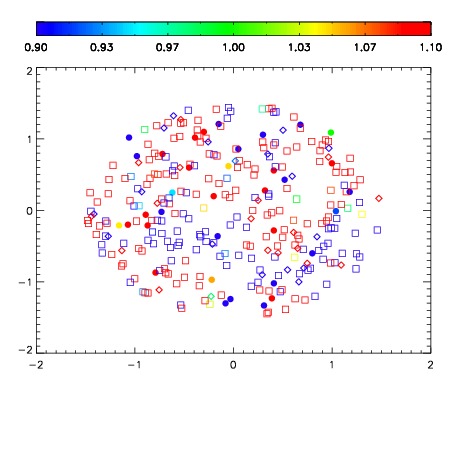
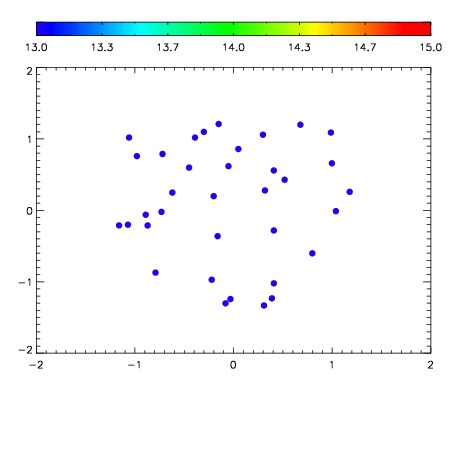

| Frame | Nreads | Zeropoints | Mag plots | Spatial mag deviation | Spatial sky 16325A emission deviations (filled: sky, open: star) | Spatial sky continuum emission | Spatial sky telluric CO2 absorption deviations (filled: H < 10) | |||||||||||||||||||||||
| 0 | 0 |
|
|
|
|
|
|
| IPAIR | NAME | SHIFT | NEWSHIFT | S/N | NAME | SHIFT | NEWSHIFT | S/N |
| 0 | 03210046 | 0.510739 | 0.00000 | 145.187 | 03210047 | 0.00115907 | 0.509580 | 134.290 |
| 1 | 03210042 | 0.510333 | 0.000406027 | 205.123 | 03210040 | 0.00000 | 0.510739 | 210.768 |
| 2 | 03210041 | 0.503153 | 0.00758600 | 177.334 | 03210043 | 0.00134132 | 0.509398 | 198.515 |
| 3 | 03210045 | 0.502391 | 0.00834805 | 171.606 | 03210044 | 9.70196e-05 | 0.510642 | 192.345 |