| Red | Green | Blue | |
| z | 17.64 | ||
| znorm | Inf | ||
| sky | -Inf | -Inf | -Inf |
| S/N | 25.2 | 44.8 | 49.6 |
| S/N(c) | 0.0 | 0.0 | 0.0 |
| SN(E/C) |
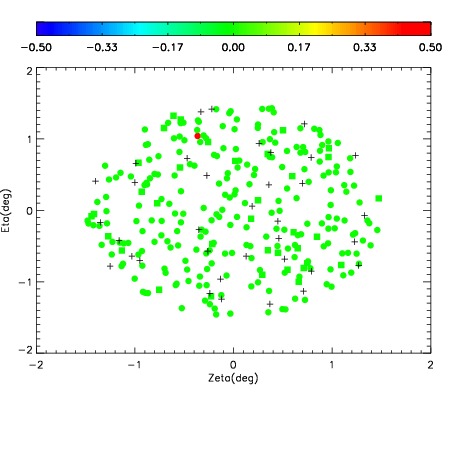
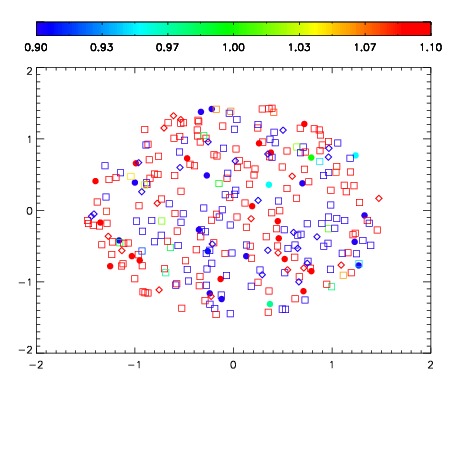
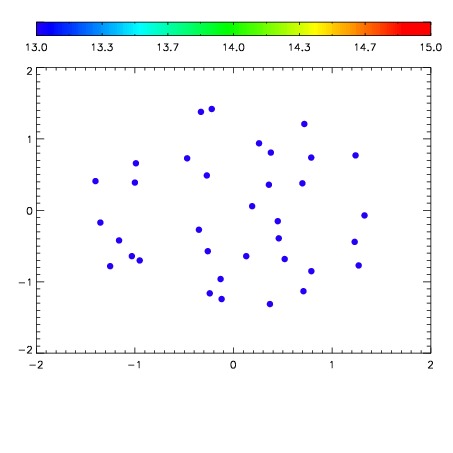

| Frame | Nreads | Zeropoints | Mag plots | Spatial mag deviation | Spatial sky 16325A emission deviations (filled: sky, open: star) | Spatial sky continuum emission | Spatial sky telluric CO2 absorption deviations (filled: H < 10) | |||||||||||||||||||||||
| 0 | 0 |
|
|
|
|
|
|
| IPAIR | NAME | SHIFT | NEWSHIFT | S/N | NAME | SHIFT | NEWSHIFT | S/N |
| 0 | 02890098 | 0.401926 | 0.00000 | 187.950 | 02890096 | 0.00000 | 0.401926 | 184.538 |
| 1 | 02890102 | 0.399356 | 0.00257000 | 198.386 | 02890103 | -0.000693302 | 0.402619 | 199.984 |
| 2 | 02890101 | 0.396929 | 0.00499701 | 197.114 | 02890099 | -0.000584176 | 0.402510 | 193.435 |
| 3 | 02890097 | 0.399276 | 0.00265002 | 189.252 | 02890100 | -0.00287153 | 0.404798 | 192.189 |