| Red | Green | Blue | |
| z | 17.64 | ||
| znorm | Inf | ||
| sky | -Inf | -Inf | -Inf |
| S/N | 23.8 | 42.9 | 46.9 |
| S/N(c) | 0.0 | 0.0 | 0.0 |
| SN(E/C) |
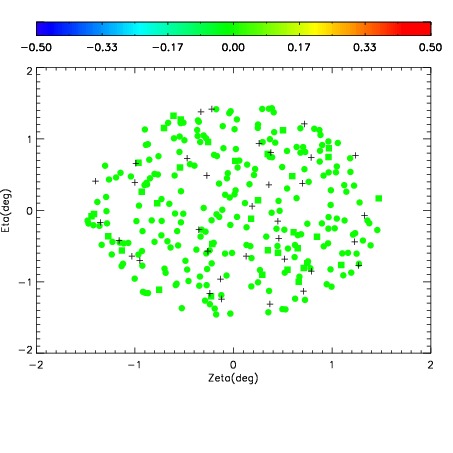
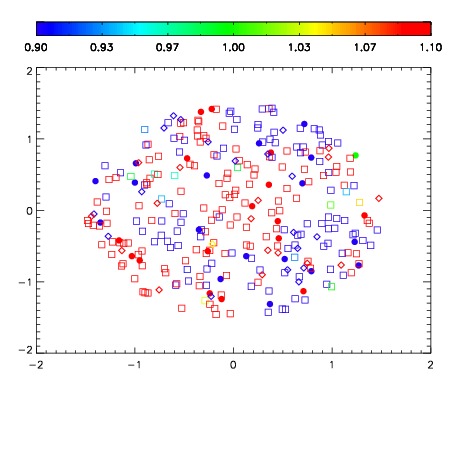
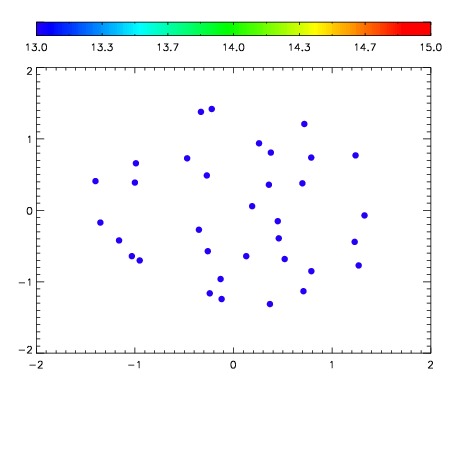

| Frame | Nreads | Zeropoints | Mag plots | Spatial mag deviation | Spatial sky 16325A emission deviations (filled: sky, open: star) | Spatial sky continuum emission | Spatial sky telluric CO2 absorption deviations (filled: H < 10) | |||||||||||||||||||||||
| 0 | 0 |
|
|
|
|
|
|
| IPAIR | NAME | SHIFT | NEWSHIFT | S/N | NAME | SHIFT | NEWSHIFT | S/N |
| 0 | 06760023 | 0.491403 | 0.00000 | 220.395 | 06760021 | 0.00000 | 0.491403 | 217.526 |
| 1 | 06760027 | 0.489613 | 0.00179002 | 224.983 | 06760028 | 0.00217104 | 0.489232 | 229.513 |
| 2 | 06760026 | 0.489011 | 0.00239202 | 221.267 | 06760025 | 0.00114271 | 0.490260 | 225.589 |
| 3 | 06760022 | 0.490987 | 0.000416011 | 221.073 | 06760024 | 0.00416636 | 0.487237 | 224.608 |