| Red | Green | Blue | |
| z | 17.64 | ||
| znorm | Inf | ||
| sky | -Inf | -Inf | -Inf |
| S/N | 18.1 | 34.0 | 35.4 |
| S/N(c) | 0.0 | 0.0 | 0.0 |
| SN(E/C) |


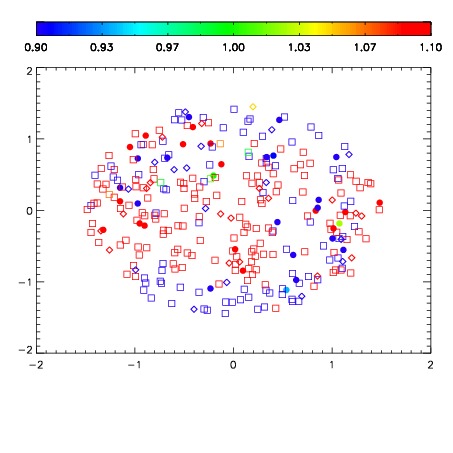


| Frame | Nreads | Zeropoints | Mag plots | Spatial mag deviation | Spatial sky 16325A emission deviations (filled: sky, open: star) | Spatial sky continuum emission | Spatial sky telluric CO2 absorption deviations (filled: H < 10) | |||||||||||||||||||||||
| 0 | 0 |
|
|
|
|
|
|
| IPAIR | NAME | SHIFT | NEWSHIFT | S/N | NAME | SHIFT | NEWSHIFT | S/N |
| 0 | 03220042 | 0.530773 | 0.00000 | 194.605 | 03220051 | 0.00261785 | 0.528155 | 175.347 |
| 1 | 03220050 | 0.519023 | 0.0117500 | 169.128 | 03220048 | 0.00197737 | 0.528796 | 158.857 |
| 2 | 03220046 | 0.525510 | 0.00526297 | 146.932 | 03220043 | -0.000177713 | 0.530951 | 140.659 |
| 3 | 03220041 | 0.524292 | 0.00648099 | 130.870 | 03220047 | 0.00231587 | 0.528457 | 127.857 |
| 4 | 03220049 | 0.517489 | 0.0132840 | 113.966 | 03220040 | 0.00000 | 0.530773 | 78.7388 |
| 5 | 03220045 | 0.518859 | 0.0119140 | 111.809 | 03220044 | 0.000460925 | 0.530312 | 50.1764 |