| Red | Green | Blue | |
| z | 17.64 | ||
| znorm | Inf | ||
| sky | -NaN | -Inf | -Inf |
| S/N | 28.7 | 51.1 | 55.6 |
| S/N(c) | 0.0 | 0.0 | 0.0 |
| SN(E/C) |


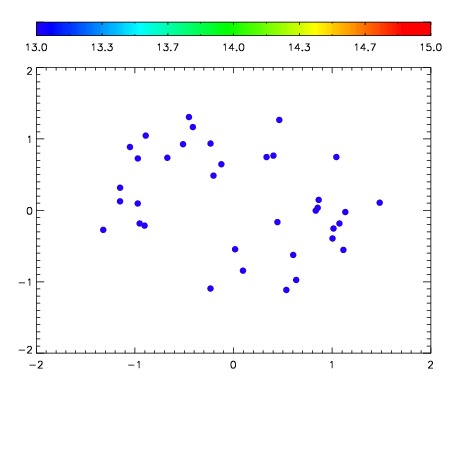

| Frame | Nreads | Zeropoints | Mag plots | Spatial mag deviation | Spatial sky 16325A emission deviations (filled: sky, open: star) | Spatial sky continuum emission | Spatial sky telluric CO2 absorption deviations (filled: H < 10) | |||||||||||||||||||||||
| 0 | 0 |
|
|
|
|
|
|
| IPAIR | NAME | SHIFT | NEWSHIFT | S/N | NAME | SHIFT | NEWSHIFT | S/N |
| 0 | 03420060 | 0.502762 | 0.00000 | 221.447 | 03420061 | 1.41041e-05 | 0.502748 | 226.458 |
| 1 | 03420063 | 0.500870 | 0.00189203 | 224.181 | 03420062 | 4.08448e-05 | 0.502721 | 231.319 |
| 2 | 03420059 | 0.500808 | 0.00195402 | 221.317 | 03420065 | 0.00310077 | 0.499661 | 223.472 |
| 3 | 03420064 | 0.502597 | 0.000165045 | 216.244 | 03420058 | 0.00000 | 0.502762 | 221.339 |