| Red | Green | Blue | |
| z | 17.64 | ||
| znorm | Inf | ||
| sky | -Inf | -Inf | -Inf |
| S/N | 23.0 | 43.4 | 47.0 |
| S/N(c) | 0.0 | 0.0 | 0.0 |
| SN(E/C) |
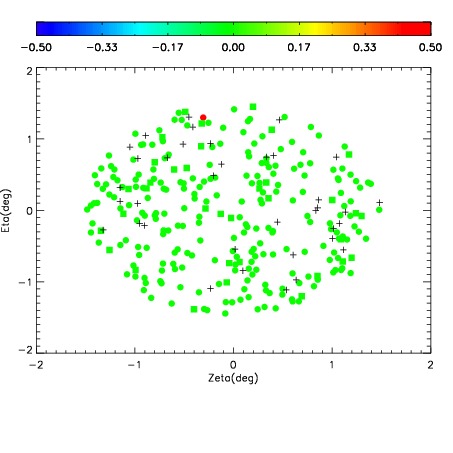
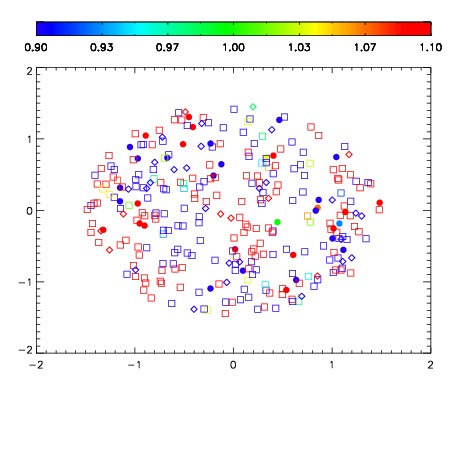
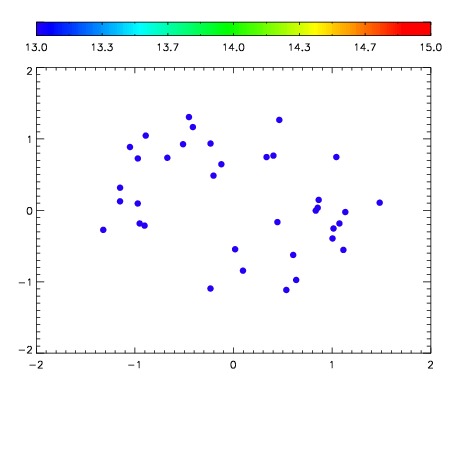

| Frame | Nreads | Zeropoints | Mag plots | Spatial mag deviation | Spatial sky 16325A emission deviations (filled: sky, open: star) | Spatial sky continuum emission | Spatial sky telluric CO2 absorption deviations (filled: H < 10) | |||||||||||||||||||||||
| 0 | 0 |
|
|
|
|
|
|
| IPAIR | NAME | SHIFT | NEWSHIFT | S/N | NAME | SHIFT | NEWSHIFT | S/N |
| 0 | 03430069 | 0.501919 | 0.00000 | 208.098 | 03430070 | 0.00132623 | 0.500593 | 201.052 |
| 1 | 03430068 | 0.500661 | 0.00125796 | 208.509 | 03430067 | 0.00000 | 0.501919 | 208.335 |
| 2 | 03430072 | 0.497907 | 0.00401196 | 189.000 | 03430071 | -0.00274361 | 0.504663 | 192.280 |
| 3 | 03430073 | 0.501552 | 0.000366986 | 166.546 | 03430074 | 0.000628818 | 0.501290 | 190.159 |