| Red | Green | Blue | |
| z | 17.64 | ||
| znorm | Inf | ||
| sky | -NaN | -Inf | -Inf |
| S/N | 27.4 | 47.8 | 51.8 |
| S/N(c) | 0.0 | 0.0 | 0.0 |
| SN(E/C) |
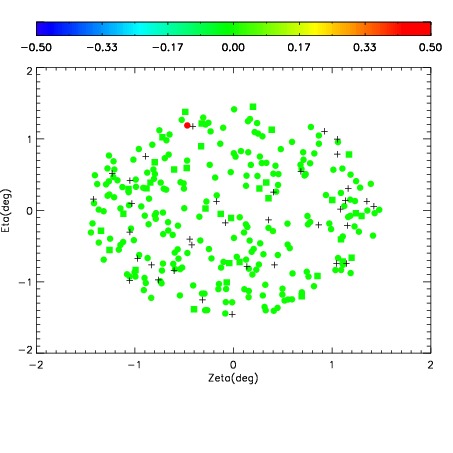
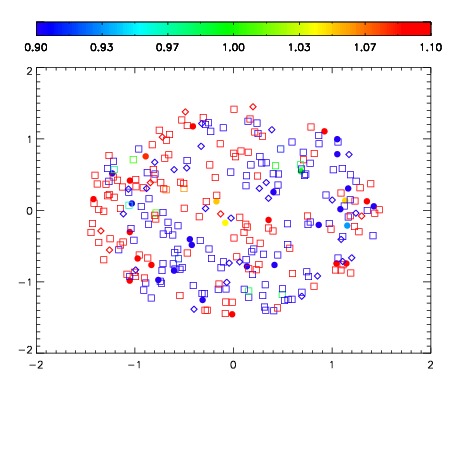


| Frame | Nreads | Zeropoints | Mag plots | Spatial mag deviation | Spatial sky 16325A emission deviations (filled: sky, open: star) | Spatial sky continuum emission | Spatial sky telluric CO2 absorption deviations (filled: H < 10) | |||||||||||||||||||||||
| 0 | 0 |
|
|
|
|
|
|
| IPAIR | NAME | SHIFT | NEWSHIFT | S/N | NAME | SHIFT | NEWSHIFT | S/N |
| 0 | 02820096 | 0.420937 | 0.00000 | 246.872 | 02820097 | 0.00208712 | 0.418850 | 251.817 |
| 1 | 02820095 | 0.413869 | 0.00706801 | 245.221 | 02820094 | -0.000567554 | 0.421505 | 240.418 |
| 2 | 02820091 | 0.412123 | 0.00881401 | 241.848 | 02820093 | 0.000382541 | 0.420554 | 232.436 |
| 3 | 02820092 | 0.415553 | 0.00538400 | 238.929 | 02820090 | 0.00000 | 0.420937 | 226.898 |