| Red | Green | Blue | |
| z | 17.64 | ||
| znorm | Inf | ||
| sky | -Inf | -Inf | -Inf |
| S/N | 28.3 | 50.4 | 54.1 |
| S/N(c) | 0.0 | 0.0 | 0.0 |
| SN(E/C) |
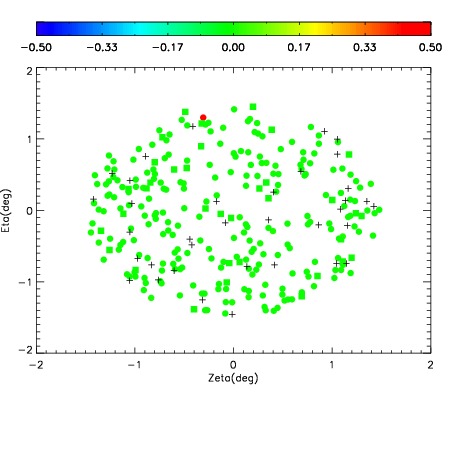
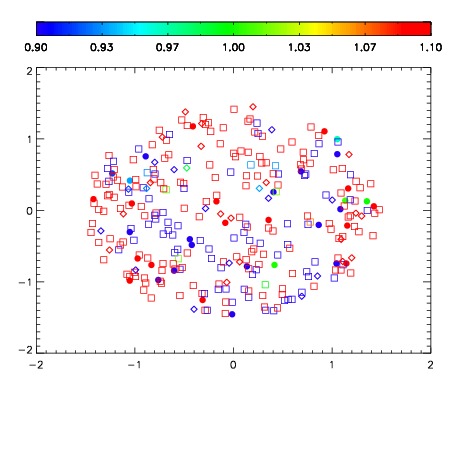
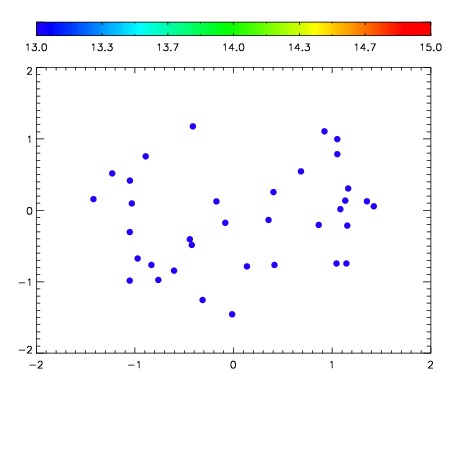

| Frame | Nreads | Zeropoints | Mag plots | Spatial mag deviation | Spatial sky 16325A emission deviations (filled: sky, open: star) | Spatial sky continuum emission | Spatial sky telluric CO2 absorption deviations (filled: H < 10) | |||||||||||||||||||||||
| 0 | 0 |
|
|
|
|
|
|
| IPAIR | NAME | SHIFT | NEWSHIFT | S/N | NAME | SHIFT | NEWSHIFT | S/N |
| 0 | 03440067 | 0.510297 | 0.00000 | 247.120 | 03440068 | 0.00251501 | 0.507782 | 239.247 |
| 1 | 03440063 | 0.507828 | 0.00246900 | 255.265 | 03440065 | 0.00184526 | 0.508452 | 251.428 |
| 2 | 03440062 | 0.504534 | 0.00576299 | 250.326 | 03440064 | 0.00319589 | 0.507101 | 250.535 |
| 3 | 03440066 | 0.509210 | 0.00108701 | 249.078 | 03440061 | 0.00000 | 0.510297 | 242.364 |