| Red | Green | Blue | |
| z | 17.64 | ||
| znorm | Inf | ||
| sky | -Inf | -Inf | -Inf |
| S/N | 25.7 | 45.4 | 49.3 |
| S/N(c) | 0.0 | 0.0 | 0.0 |
| SN(E/C) |

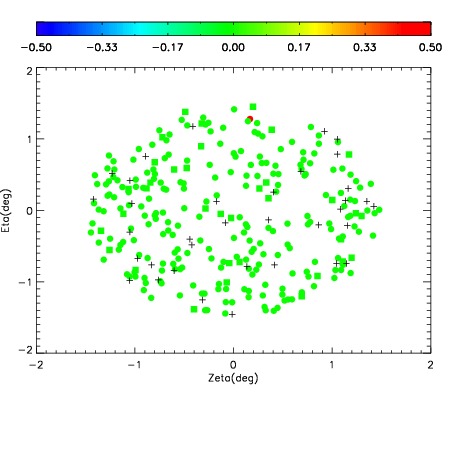
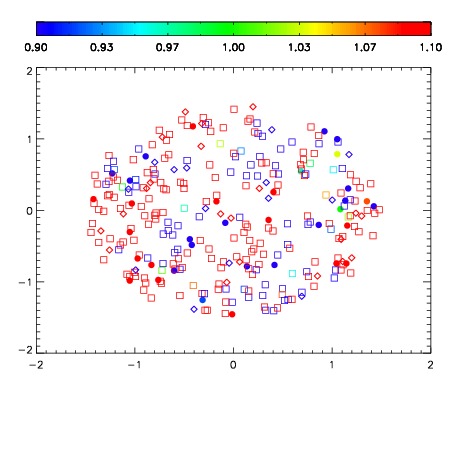
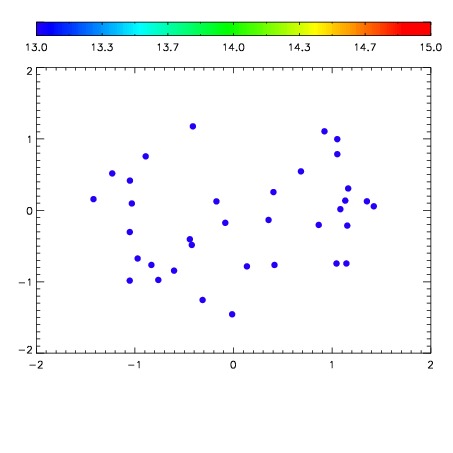

| Frame | Nreads | Zeropoints | Mag plots | Spatial mag deviation | Spatial sky 16325A emission deviations (filled: sky, open: star) | Spatial sky continuum emission | Spatial sky telluric CO2 absorption deviations (filled: H < 10) | |||||||||||||||||||||||
| 0 | 0 |
|
|
|
|
|
|
| IPAIR | NAME | SHIFT | NEWSHIFT | S/N | NAME | SHIFT | NEWSHIFT | S/N |
| 0 | 03690058 | 0.502609 | 0.00000 | 231.828 | 03690056 | 0.00000 | 0.502609 | 226.024 |
| 1 | 03690061 | 0.498063 | 0.00454602 | 214.364 | 03690059 | -0.000369250 | 0.502978 | 218.128 |
| 2 | 03690057 | 0.499635 | 0.00297400 | 212.553 | 03690060 | 0.00380660 | 0.498802 | 213.269 |
| 3 | 03690062 | 0.500153 | 0.00245601 | 210.839 | 03690063 | 0.00370867 | 0.498900 | 209.044 |