| Red | Green | Blue | |
| z | 17.64 | ||
| znorm | Inf | ||
| sky | -Inf | -Inf | -Inf |
| S/N | 28.7 | 50.5 | 54.0 |
| S/N(c) | 0.0 | 0.0 | 0.0 |
| SN(E/C) |
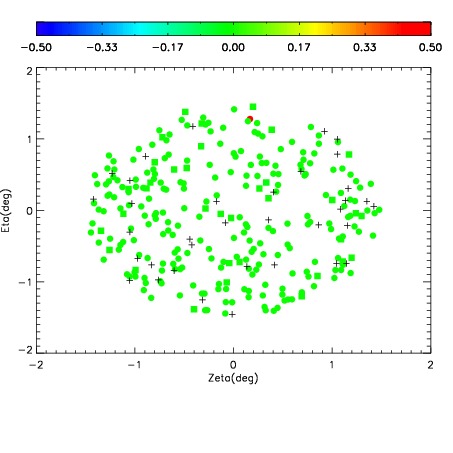
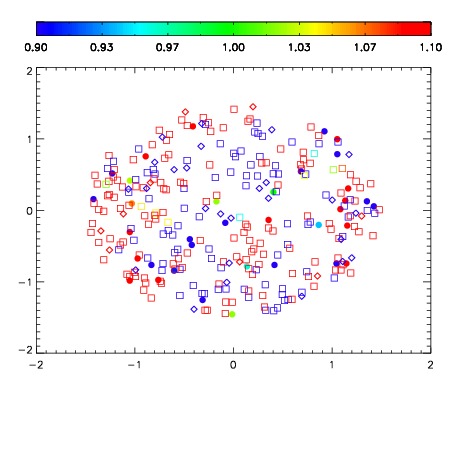
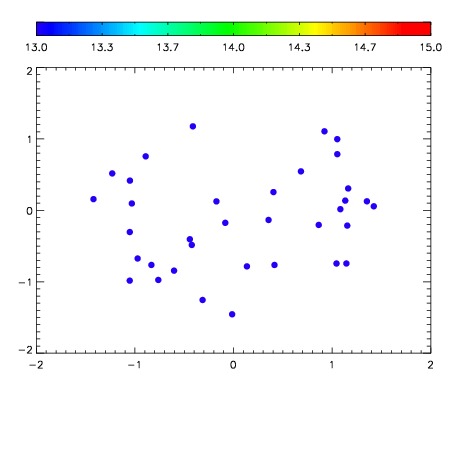

| Frame | Nreads | Zeropoints | Mag plots | Spatial mag deviation | Spatial sky 16325A emission deviations (filled: sky, open: star) | Spatial sky continuum emission | Spatial sky telluric CO2 absorption deviations (filled: H < 10) | |||||||||||||||||||||||
| 0 | 0 |
|
|
|
|
|
|
| IPAIR | NAME | SHIFT | NEWSHIFT | S/N | NAME | SHIFT | NEWSHIFT | S/N |
| 0 | 03700051 | 0.497874 | 0.00000 | 225.784 | 03700056 | -0.000479890 | 0.498354 | 222.908 |
| 1 | 03700055 | 0.497395 | 0.000478983 | 233.124 | 03700052 | 0.00150318 | 0.496371 | 239.736 |
| 2 | 03700054 | 0.495119 | 0.00275499 | 230.703 | 03700053 | 0.000285090 | 0.497589 | 229.069 |
| 3 | 03700050 | 0.496415 | 0.00145900 | 222.867 | 03700049 | 0.00000 | 0.497874 | 210.958 |