| Red | Green | Blue | |
| z | 17.64 | ||
| znorm | Inf | ||
| sky | -NaN | -Inf | -Inf |
| S/N | 29.6 | 51.5 | 55.8 |
| S/N(c) | 0.0 | 0.0 | 0.0 |
| SN(E/C) |
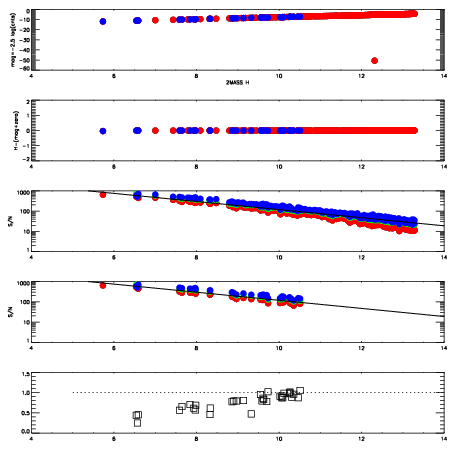
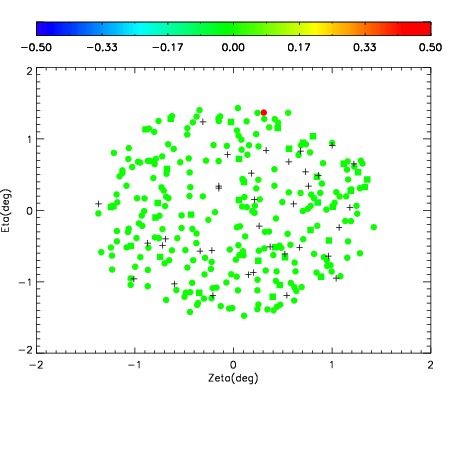
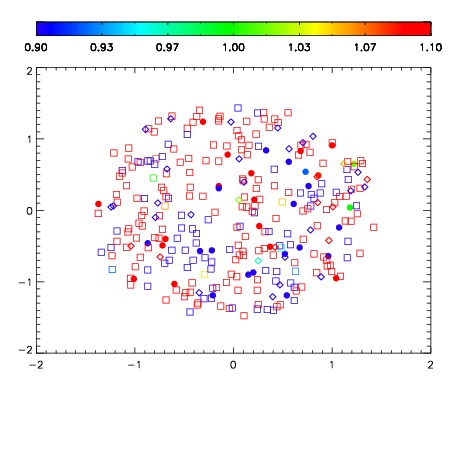
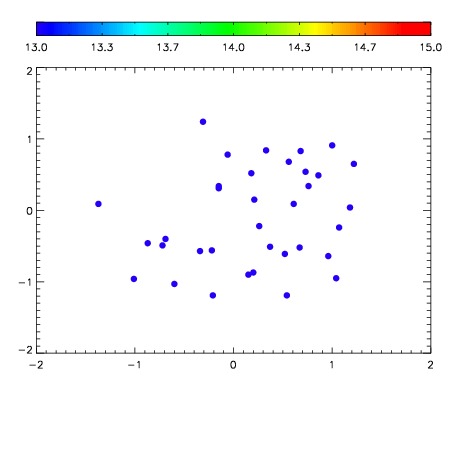

| Frame | Nreads | Zeropoints | Mag plots | Spatial mag deviation | Spatial sky 16325A emission deviations (filled: sky, open: star) | Spatial sky continuum emission | Spatial sky telluric CO2 absorption deviations (filled: H < 10) | |||||||||||||||||||||||
| 0 | 0 |
|
|
|
|
|
|
| IPAIR | NAME | SHIFT | NEWSHIFT | S/N | NAME | SHIFT | NEWSHIFT | S/N |
| 0 | 03720051 | 0.515204 | 0.00000 | 224.181 | 03720053 | 0.000100788 | 0.515103 | 225.253 |
| 1 | 03720050 | 0.511000 | 0.00420403 | 223.067 | 03720052 | 0.00188821 | 0.513316 | 223.367 |
| 2 | 03720054 | 0.511266 | 0.00393802 | 222.403 | 03720056 | 0.00124251 | 0.513961 | 220.239 |
| 3 | 03720055 | 0.512869 | 0.00233501 | 221.076 | 03720049 | 0.00000 | 0.515204 | 218.221 |