| Red | Green | Blue | |
| z | 17.64 | ||
| znorm | Inf | ||
| sky | -Inf | -Inf | -Inf |
| S/N | 14.8 | 27.1 | 27.9 |
| S/N(c) | 0.0 | 0.0 | 0.0 |
| SN(E/C) |
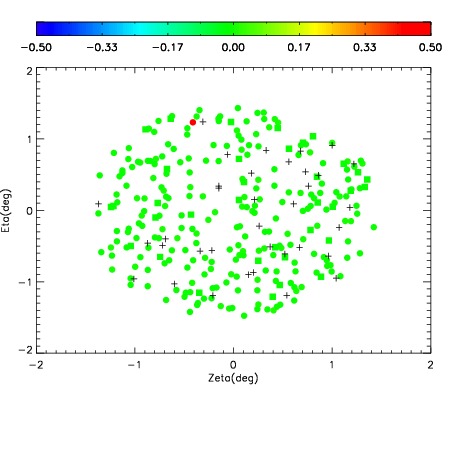
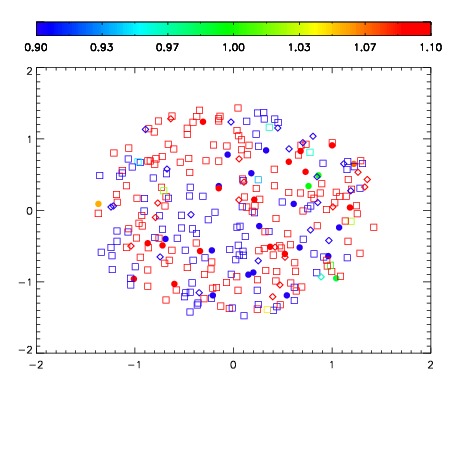
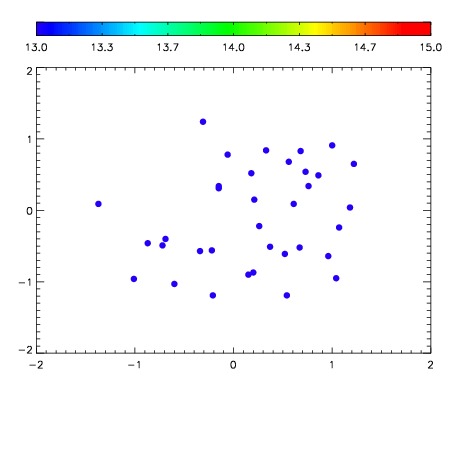

| Frame | Nreads | Zeropoints | Mag plots | Spatial mag deviation | Spatial sky 16325A emission deviations (filled: sky, open: star) | Spatial sky continuum emission | Spatial sky telluric CO2 absorption deviations (filled: H < 10) | |||||||||||||||||||||||
| 0 | 0 |
|
|
|
|
|
|
| IPAIR | NAME | SHIFT | NEWSHIFT | S/N | NAME | SHIFT | NEWSHIFT | S/N |
| 0 | 04270010 | 0.487386 | 0.00000 | 143.027 | 04270008 | 0.00000 | 0.487386 | 142.928 |
| 1 | 04270013 | 0.483548 | 0.00383800 | 142.355 | 04270012 | -0.00448285 | 0.491869 | 127.327 |
| 2 | 04270014 | 0.484526 | 0.00285998 | 138.642 | 04270011 | -0.00392532 | 0.491311 | 126.649 |
| 3 | 04270009 | 0.486176 | 0.00120997 | 132.217 | 04270015 | -0.00494039 | 0.492326 | 113.475 |