| Red | Green | Blue | |
| z | 17.64 | ||
| znorm | Inf | ||
| sky | -Inf | -Inf | -Inf |
| S/N | 32.0 | 56.1 | 61.0 |
| S/N(c) | 0.0 | 0.0 | 0.0 |
| SN(E/C) |
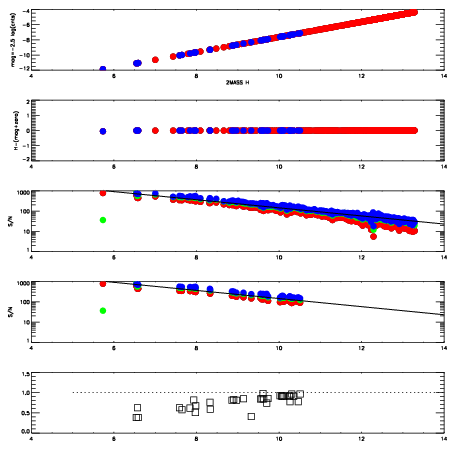
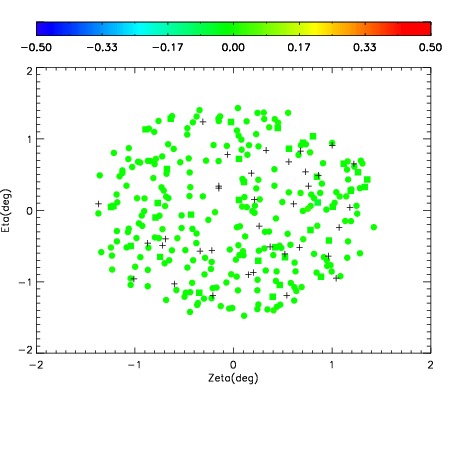
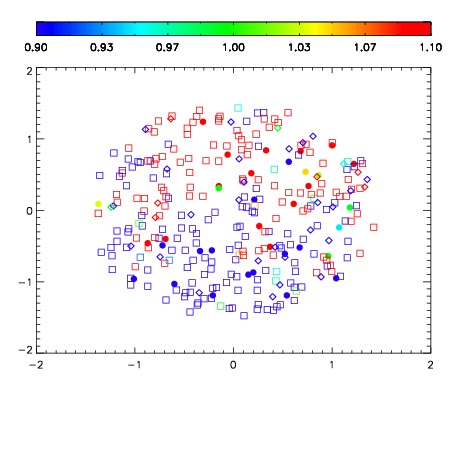
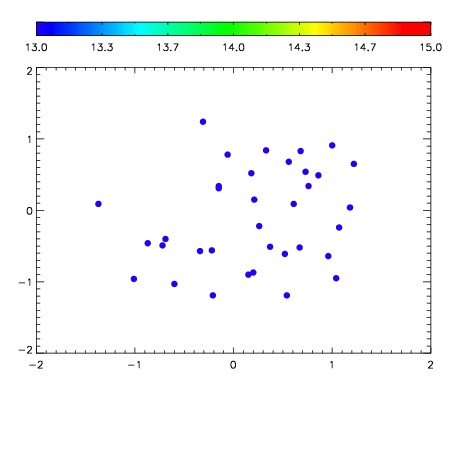

| Frame | Nreads | Zeropoints | Mag plots | Spatial mag deviation | Spatial sky 16325A emission deviations (filled: sky, open: star) | Spatial sky continuum emission | Spatial sky telluric CO2 absorption deviations (filled: H < 10) | |||||||||||||||||||||||
| 0 | 0 |
|
|
|
|
|
|
| IPAIR | NAME | SHIFT | NEWSHIFT | S/N | NAME | SHIFT | NEWSHIFT | S/N |
| 0 | 06690094 | 0.480888 | 0.00000 | 195.371 | 06690091 | 0.00253250 | 0.478355 | 197.175 |
| 1 | 06690086 | 0.479119 | 0.00176901 | 205.408 | 06690087 | 0.000754408 | 0.480134 | 211.423 |
| 2 | 06690085 | 0.477903 | 0.00298500 | 204.968 | 06690088 | -0.000220464 | 0.481108 | 204.901 |
| 3 | 06690089 | 0.477720 | 0.00316802 | 203.927 | 06690084 | 0.00000 | 0.480888 | 202.234 |
| 4 | 06690090 | 0.477917 | 0.00297102 | 203.159 | 06690095 | 0.00114435 | 0.479744 | 197.991 |
| 5 | 06690093 | 0.479937 | 0.000951022 | 188.942 | 06690092 | 0.000599088 | 0.480289 | 194.623 |