| Red | Green | Blue | |
| z | 17.64 | ||
| znorm | Inf | ||
| sky | -Inf | -Inf | -Inf |
| S/N | 25.5 | 42.2 | 47.9 |
| S/N(c) | 0.0 | 0.0 | 0.0 |
| SN(E/C) |
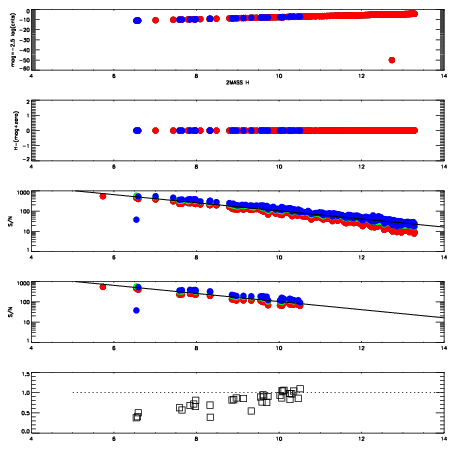
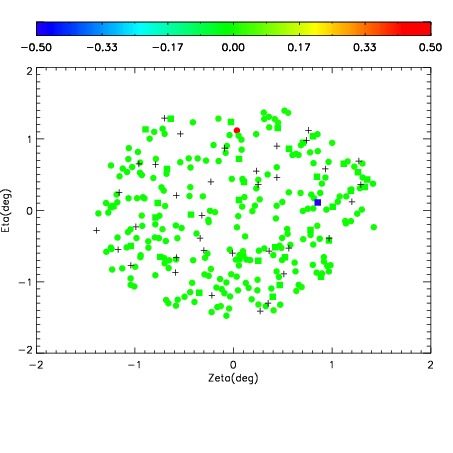
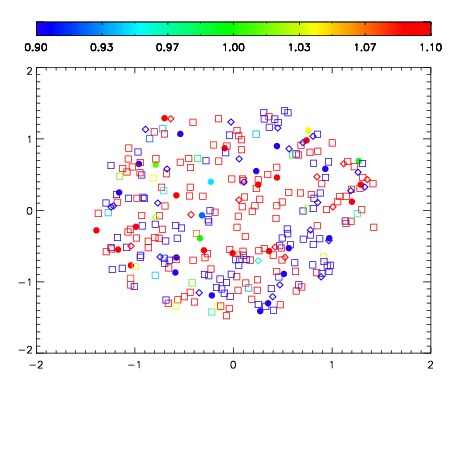
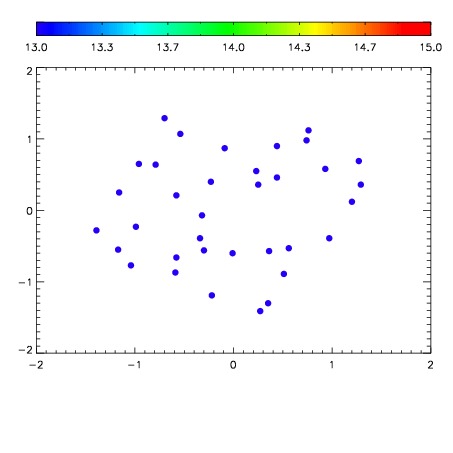

| Frame | Nreads | Zeropoints | Mag plots | Spatial mag deviation | Spatial sky 16325A emission deviations (filled: sky, open: star) | Spatial sky continuum emission | Spatial sky telluric CO2 absorption deviations (filled: H < 10) | |||||||||||||||||||||||
| 0 | 0 |
|
|
|
|
|
|
| IPAIR | NAME | SHIFT | NEWSHIFT | S/N | NAME | SHIFT | NEWSHIFT | S/N |
| 0 | 02930036 | 0.402704 | 0.00000 | 190.295 | 02930037 | 0.000552263 | 0.402152 | 190.409 |
| 1 | 02930035 | 0.401556 | 0.00114802 | 192.030 | 02930034 | 0.00000 | 0.402704 | 194.186 |
| 2 | 02930039 | 0.401986 | 0.000717998 | 188.239 | 02930038 | 2.86779e-05 | 0.402675 | 190.391 |