| Red | Green | Blue | |
| z | 17.64 | ||
| znorm | Inf | ||
| sky | -Inf | -Inf | -Inf |
| S/N | 20.1 | 36.1 | 37.2 |
| S/N(c) | 0.0 | 0.0 | 0.0 |
| SN(E/C) |
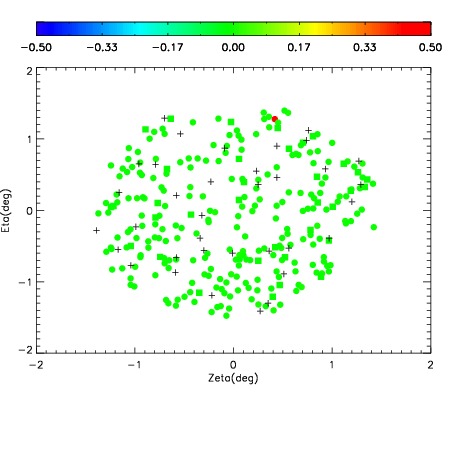
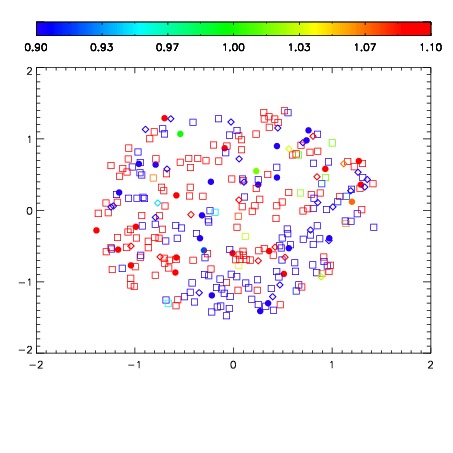
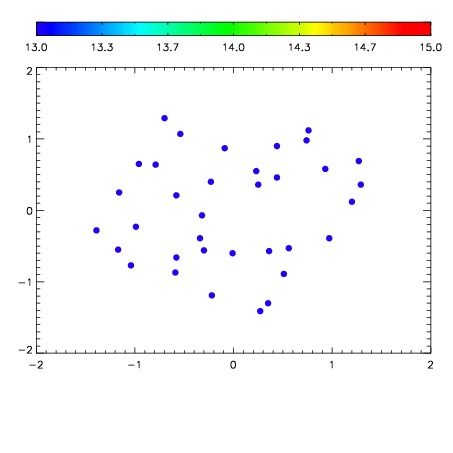

| Frame | Nreads | Zeropoints | Mag plots | Spatial mag deviation | Spatial sky 16325A emission deviations (filled: sky, open: star) | Spatial sky continuum emission | Spatial sky telluric CO2 absorption deviations (filled: H < 10) | |||||||||||||||||||||||
| 0 | 0 |
|
|
|
|
|
|
| IPAIR | NAME | SHIFT | NEWSHIFT | S/N | NAME | SHIFT | NEWSHIFT | S/N |
| 0 | 03740014 | 0.505194 | 0.00000 | 152.142 | 03740015 | 0.00236170 | 0.502832 | 161.308 |
| 1 | 03740013 | 0.500701 | 0.00449300 | 162.590 | 03740012 | -8.15709e-05 | 0.505276 | 168.510 |
| 2 | 03740009 | 0.503253 | 0.00194103 | 159.829 | 03740011 | 0.000827658 | 0.504366 | 165.976 |
| 3 | 03740010 | 0.503100 | 0.00209403 | 159.441 | 03740008 | 0.00000 | 0.505194 | 162.550 |