| Red | Green | Blue | |
| z | 17.64 | ||
| znorm | Inf | ||
| sky | -Inf | -Inf | -Inf |
| S/N | 24.3 | 40.8 | 47.3 |
| S/N(c) | 0.0 | 0.0 | 0.0 |
| SN(E/C) |
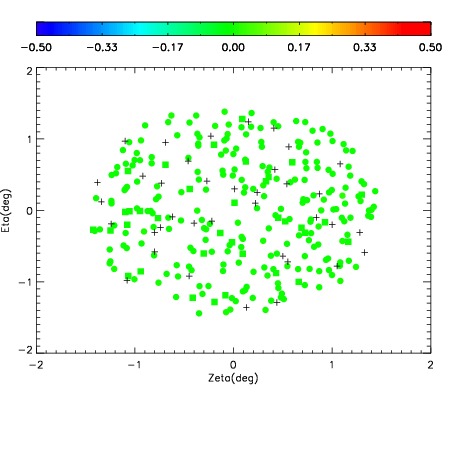
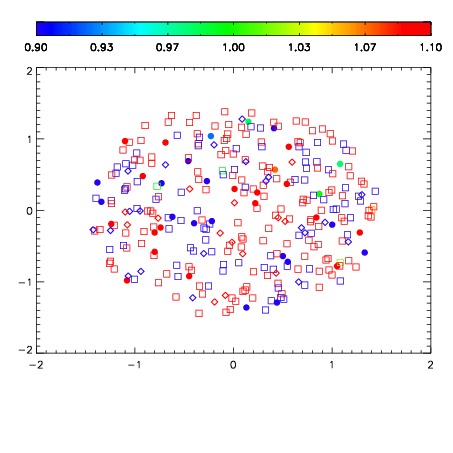
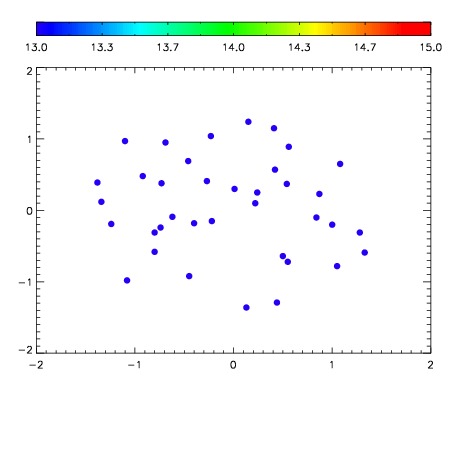

| Frame | Nreads | Zeropoints | Mag plots | Spatial mag deviation | Spatial sky 16325A emission deviations (filled: sky, open: star) | Spatial sky continuum emission | Spatial sky telluric CO2 absorption deviations (filled: H < 10) | |||||||||||||||||||||||
| 0 | 0 |
|
|
|
|
|
|
| IPAIR | NAME | SHIFT | NEWSHIFT | S/N | NAME | SHIFT | NEWSHIFT | S/N |
| 0 | 02920036 | 0.402263 | 0.00000 | 209.946 | 02920041 | 0.00144151 | 0.400821 | 211.385 |
| 1 | 02920040 | 0.400465 | 0.00179797 | 205.743 | 02920037 | -0.000517313 | 0.402780 | 209.894 |
| 2 | 02920039 | 0.399968 | 0.00229499 | 205.097 | 02920038 | -0.00252139 | 0.404784 | 205.210 |
| 3 | 02920035 | 0.400304 | 0.00195900 | 201.184 | 02920034 | 0.00000 | 0.402263 | 197.849 |