| Red | Green | Blue | |
| z | 17.64 | ||
| znorm | Inf | ||
| sky | -Inf | -Inf | -Inf |
| S/N | 23.8 | 41.4 | 46.8 |
| S/N(c) | 0.0 | 0.0 | 0.0 |
| SN(E/C) |
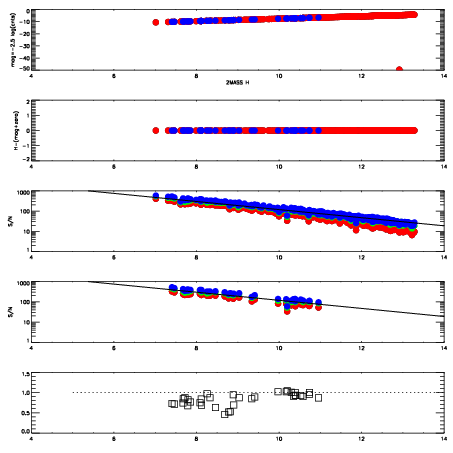
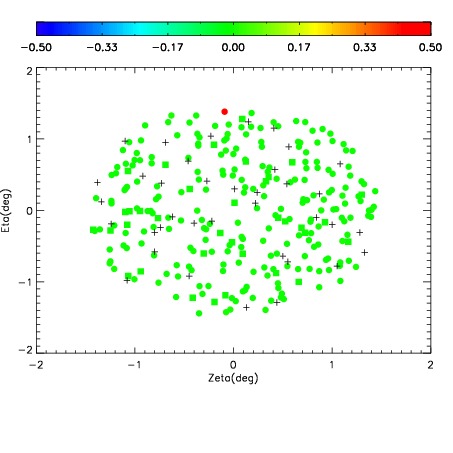
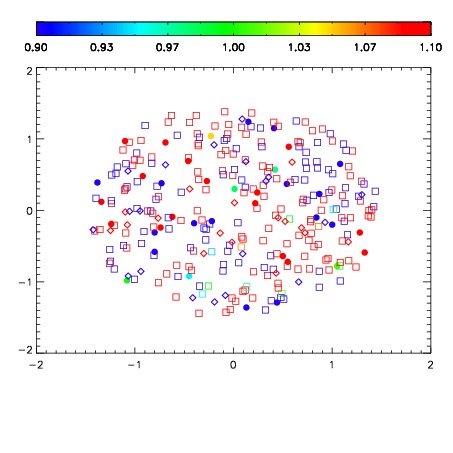
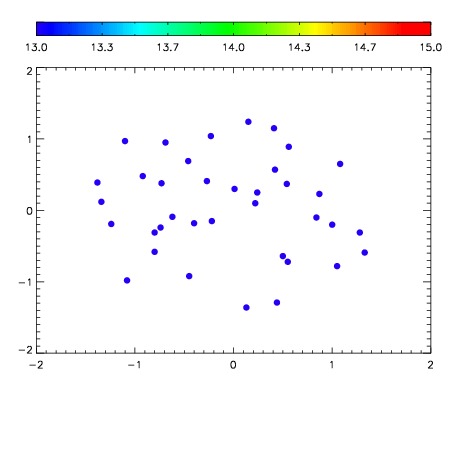

| Frame | Nreads | Zeropoints | Mag plots | Spatial mag deviation | Spatial sky 16325A emission deviations (filled: sky, open: star) | Spatial sky continuum emission | Spatial sky telluric CO2 absorption deviations (filled: H < 10) | |||||||||||||||||||||||
| 0 | 0 |
|
|
|
|
|
|
| IPAIR | NAME | SHIFT | NEWSHIFT | S/N | NAME | SHIFT | NEWSHIFT | S/N |
| 0 | 03180031 | 0.503246 | 0.00000 | 140.698 | 03180032 | 0.00112419 | 0.502122 | 141.113 |
| 1 | 03180030 | 0.496561 | 0.00668502 | 136.602 | 03180029 | -0.000910667 | 0.504157 | 138.839 |
| 2 | 03180026 | 0.496363 | 0.00688300 | 128.938 | 03180028 | 2.27331e-05 | 0.503223 | 135.866 |
| 3 | 03180027 | 0.498089 | 0.00515702 | 128.533 | 03180025 | 0.00000 | 0.503246 | 132.531 |