| Red | Green | Blue | |
| z | 17.64 | ||
| znorm | Inf | ||
| sky | -Inf | -Inf | -Inf |
| S/N | 22.2 | 40.0 | 45.9 |
| S/N(c) | 0.0 | 0.0 | 0.0 |
| SN(E/C) |
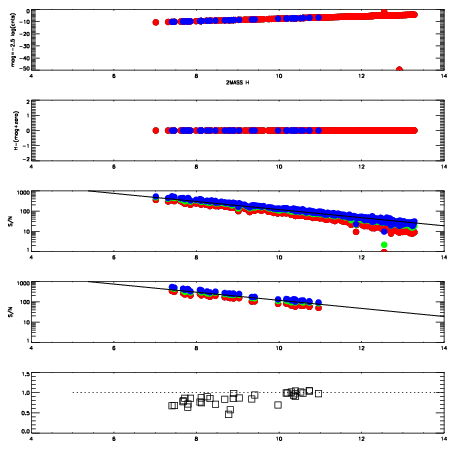
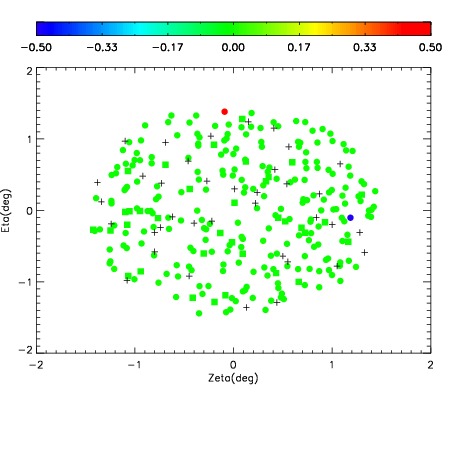
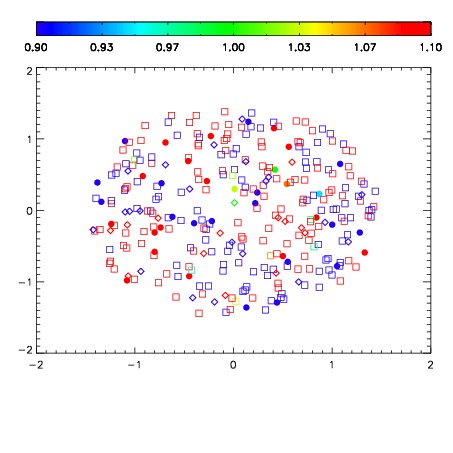
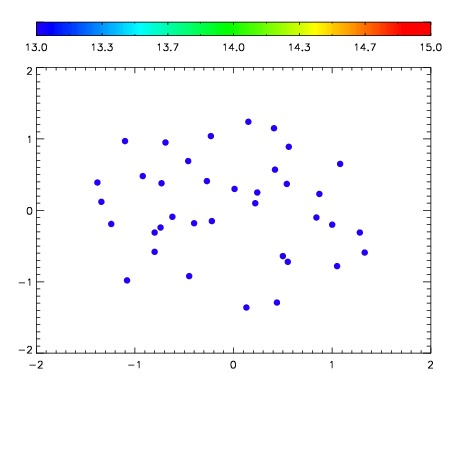

| Frame | Nreads | Zeropoints | Mag plots | Spatial mag deviation | Spatial sky 16325A emission deviations (filled: sky, open: star) | Spatial sky continuum emission | Spatial sky telluric CO2 absorption deviations (filled: H < 10) | |||||||||||||||||||||||
| 0 | 0 |
|
|
|
|
|
|
| IPAIR | NAME | SHIFT | NEWSHIFT | S/N | NAME | SHIFT | NEWSHIFT | S/N |
| 0 | 03480042 | 0.504599 | 0.00000 | 192.840 | 03480036 | 0.00000 | 0.504599 | 193.636 |
| 1 | 03480037 | 0.498913 | 0.00568599 | 195.337 | 03480043 | 0.00294378 | 0.501655 | 194.046 |
| 2 | 03480038 | 0.500860 | 0.00373900 | 185.319 | 03480039 | 0.00156287 | 0.503036 | 184.323 |
| 3 | 03480041 | 0.503339 | 0.00125998 | 159.544 | 03480040 | 0.00133659 | 0.503262 | 171.308 |