| Red | Green | Blue | |
| z | 17.64 | ||
| znorm | Inf | ||
| sky | -Inf | -Inf | -Inf |
| S/N | 31.7 | 54.4 | 58.3 |
| S/N(c) | 0.0 | 0.0 | 0.0 |
| SN(E/C) |
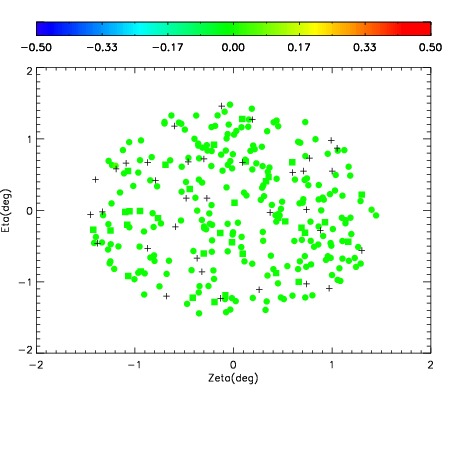
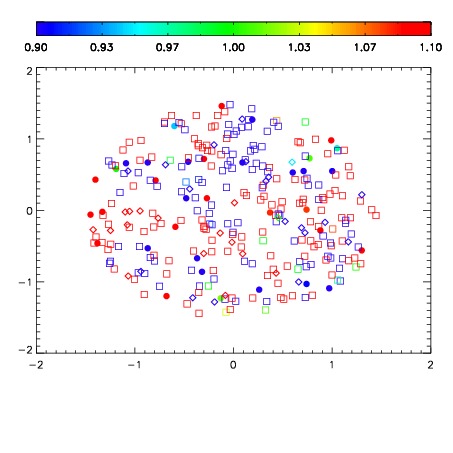
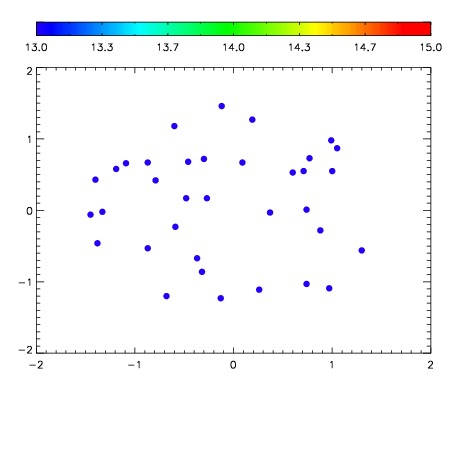

| Frame | Nreads | Zeropoints | Mag plots | Spatial mag deviation | Spatial sky 16325A emission deviations (filled: sky, open: star) | Spatial sky continuum emission | Spatial sky telluric CO2 absorption deviations (filled: H < 10) | |||||||||||||||||||||||
| 0 | 0 |
|
|
|
|
|
|
| IPAIR | NAME | SHIFT | NEWSHIFT | S/N | NAME | SHIFT | NEWSHIFT | S/N |
| 0 | 02910055 | 0.401297 | 0.00000 | 180.891 | 02910057 | 0.000994150 | 0.400303 | 181.628 |
| 1 | 02910051 | 0.400191 | 0.00110599 | 193.191 | 02910052 | 0.00269065 | 0.398606 | 196.220 |
| 2 | 02910050 | 0.399138 | 0.00215900 | 190.624 | 02910053 | 7.75839e-05 | 0.401219 | 193.517 |
| 3 | 02910058 | 0.398613 | 0.00268400 | 186.294 | 02910049 | 0.00000 | 0.401297 | 187.235 |
| 4 | 02910054 | 0.400529 | 0.000768006 | 185.960 | 02910056 | 0.00193032 | 0.399367 | 184.060 |