| Red | Green | Blue | |
| z | 17.64 | ||
| znorm | Inf | ||
| sky | -Inf | -Inf | -Inf |
| S/N | 30.8 | 52.1 | 57.4 |
| S/N(c) | 0.0 | 0.0 | 0.0 |
| SN(E/C) |
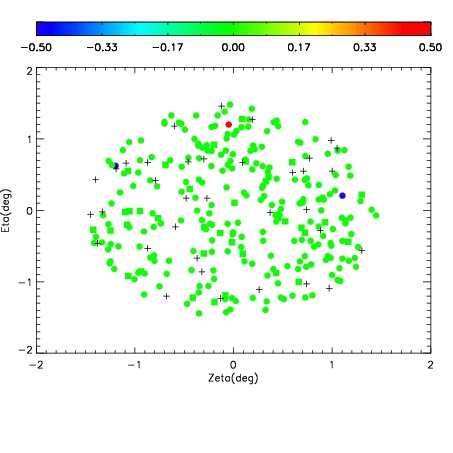
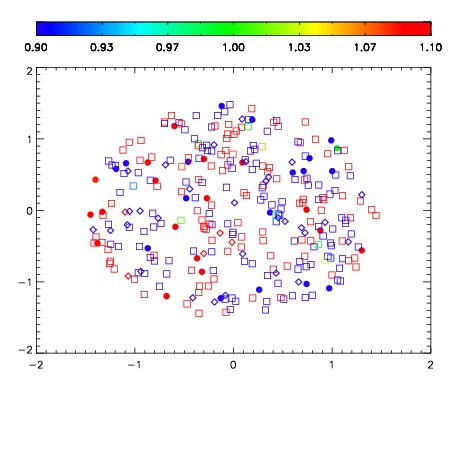
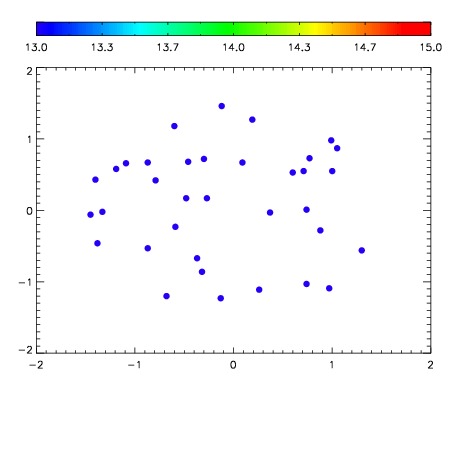

| Frame | Nreads | Zeropoints | Mag plots | Spatial mag deviation | Spatial sky 16325A emission deviations (filled: sky, open: star) | Spatial sky continuum emission | Spatial sky telluric CO2 absorption deviations (filled: H < 10) | |||||||||||||||||||||||
| 0 | 0 |
|
|
|
|
|
|
| IPAIR | NAME | SHIFT | NEWSHIFT | S/N | NAME | SHIFT | NEWSHIFT | S/N |
| 0 | 03670050 | 0.501466 | 0.00000 | 184.993 | 03670051 | 0.000768864 | 0.500697 | 191.162 |
| 1 | 03670054 | 0.500034 | 0.00143200 | 195.960 | 03670048 | 0.00000 | 0.501466 | 194.550 |
| 2 | 03670049 | 0.496927 | 0.00453898 | 193.640 | 03670052 | 0.000227991 | 0.501238 | 193.768 |
| 3 | 03670053 | 0.496391 | 0.00507498 | 186.369 | 03670055 | 0.000835961 | 0.500630 | 191.692 |