| Red | Green | Blue | |
| z | 17.64 | ||
| znorm | Inf | ||
| sky | -Inf | -Inf | -Inf |
| S/N | 28.1 | 49.2 | 53.2 |
| S/N(c) | 0.0 | 0.0 | 0.0 |
| SN(E/C) |
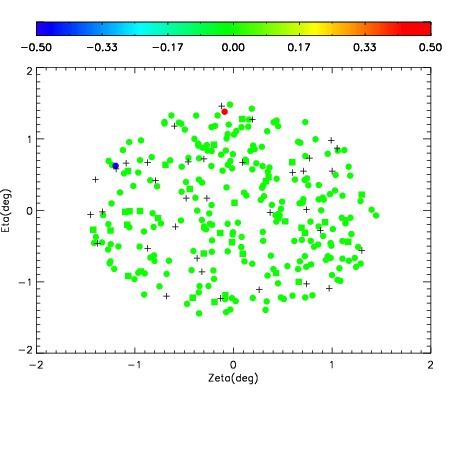
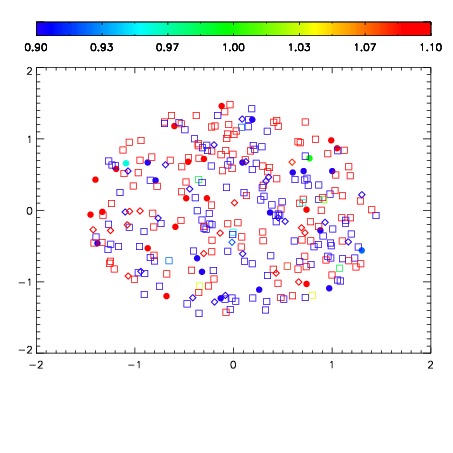
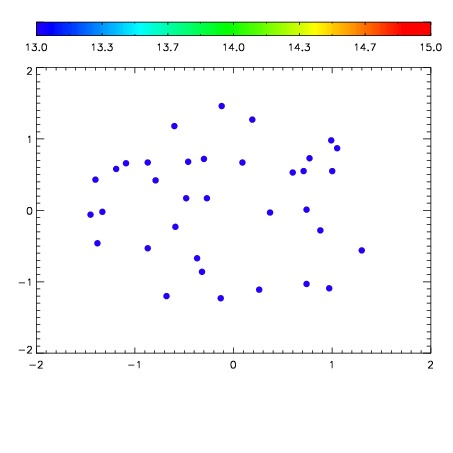

| Frame | Nreads | Zeropoints | Mag plots | Spatial mag deviation | Spatial sky 16325A emission deviations (filled: sky, open: star) | Spatial sky continuum emission | Spatial sky telluric CO2 absorption deviations (filled: H < 10) | |||||||||||||||||||||||
| 0 | 0 |
|
|
|
|
|
|
| IPAIR | NAME | SHIFT | NEWSHIFT | S/N | NAME | SHIFT | NEWSHIFT | S/N |
| 0 | 03710057 | 0.505287 | 0.00000 | 174.255 | 03710054 | 0.00219731 | 0.503090 | 174.133 |
| 1 | 03710056 | 0.498581 | 0.00670600 | 178.845 | 03710055 | 3.67396e-05 | 0.505250 | 179.566 |
| 2 | 03710053 | 0.504468 | 0.000818968 | 170.005 | 03710058 | 0.00294973 | 0.502337 | 173.233 |
| 3 | 03710052 | 0.502061 | 0.00322598 | 166.613 | 03710051 | 0.00000 | 0.505287 | 166.320 |