| Red | Green | Blue | |
| z | 17.63 | ||
| znorm | Inf | ||
| sky | -NaN | -NaN | -NaN |
| S/N | 22.7 | 35.7 | 37.6 |
| S/N(c) | 0.0 | 0.0 | 0.0 |
| SN(E/C) |
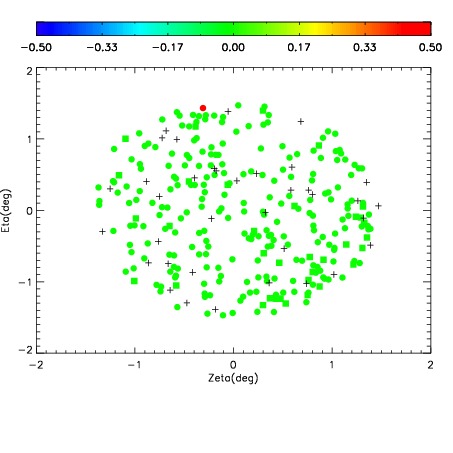
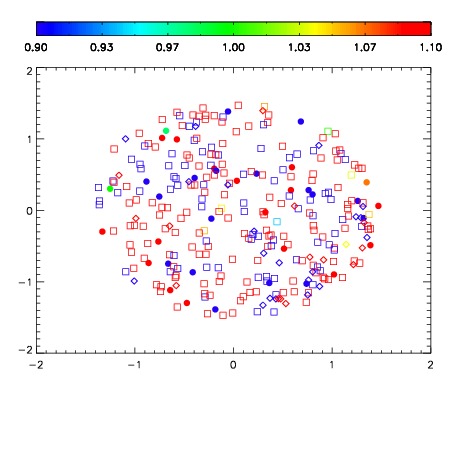
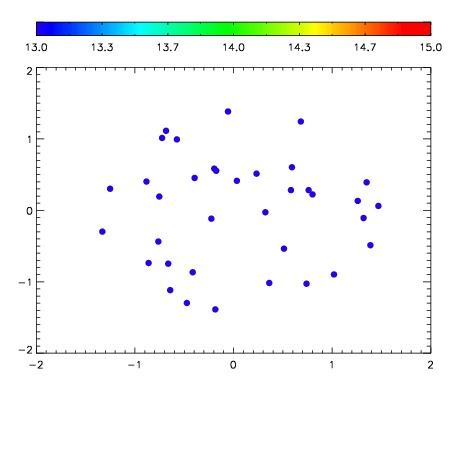

| Frame | Nreads | Zeropoints | Mag plots | Spatial mag deviation | Spatial sky 16325A emission deviations (filled: sky, open: star) | Spatial sky continuum emission | Spatial sky telluric CO2 absorption deviations (filled: H < 10) | |||||||||||||||||||||||
| 0 | 0 |
|
|
|
|
|
|
| IPAIR | NAME | SHIFT | NEWSHIFT | S/N | NAME | SHIFT | NEWSHIFT | S/N |
| 0 | 05490039 | 0.488360 | 0.00000 | 192.748 | 05490040 | 0.00378760 | 0.484572 | 200.609 |
| 1 | 05490038 | 0.485825 | 0.00253499 | 179.971 | 05490037 | -0.000596276 | 0.488956 | 181.754 |
| 2 | 05490035 | 0.485901 | 0.00245899 | 174.175 | 05490036 | 0.00111693 | 0.487243 | 174.179 |
| 3 | 05490034 | 0.484314 | 0.00404599 | 167.301 | 05490033 | 0.00000 | 0.488360 | 147.640 |