| Red | Green | Blue | |
| z | 17.63 | ||
| znorm | Inf | ||
| sky | -NaN | -NaN | -Inf |
| S/N | 27.1 | 42.2 | 44.3 |
| S/N(c) | 0.0 | 0.0 | 0.0 |
| SN(E/C) |
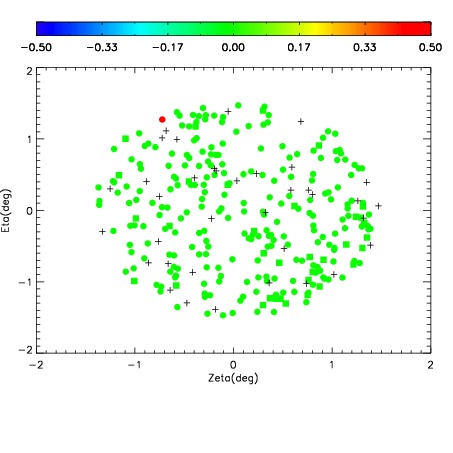
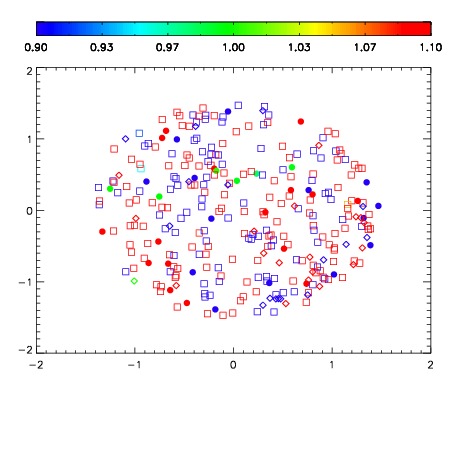
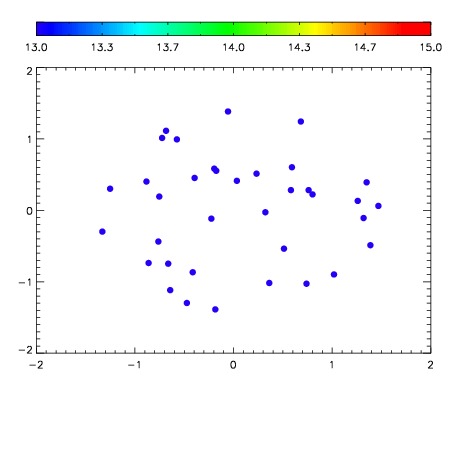

| Frame | Nreads | Zeropoints | Mag plots | Spatial mag deviation | Spatial sky 16325A emission deviations (filled: sky, open: star) | Spatial sky continuum emission | Spatial sky telluric CO2 absorption deviations (filled: H < 10) | |||||||||||||||||||||||
| 0 | 0 |
|
|
|
|
|
|
| IPAIR | NAME | SHIFT | NEWSHIFT | S/N | NAME | SHIFT | NEWSHIFT | S/N |
| 0 | 09790028 | 0.515427 | 0.00000 | 207.829 | 09790026 | 0.00000 | 0.515427 | 202.542 |
| 1 | 09790032 | 0.513362 | 0.00206500 | 230.786 | 09790033 | 0.00170306 | 0.513724 | 234.725 |
| 2 | 09790031 | 0.513757 | 0.00167000 | 227.194 | 09790030 | 0.00251179 | 0.512915 | 224.668 |
| 3 | 09790027 | 0.515261 | 0.000165999 | 210.583 | 09790029 | 0.00301700 | 0.512410 | 206.534 |