| Frame | Nreads | Zeropoints | Mag plots
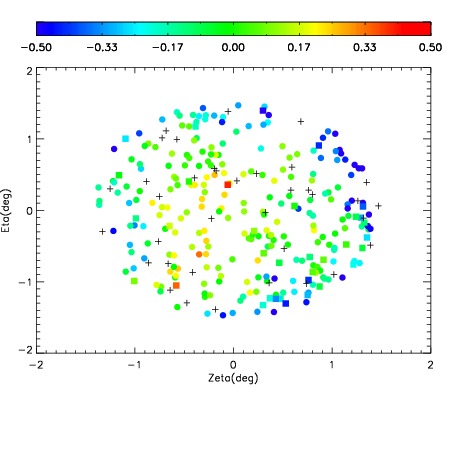
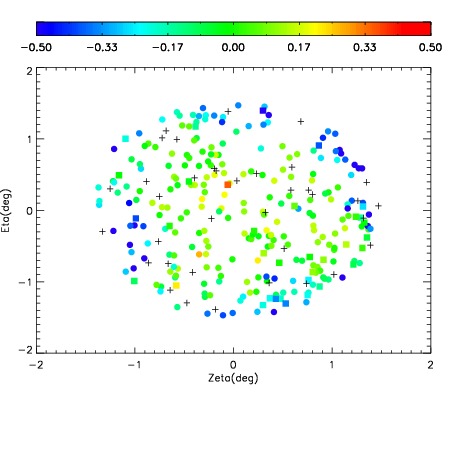
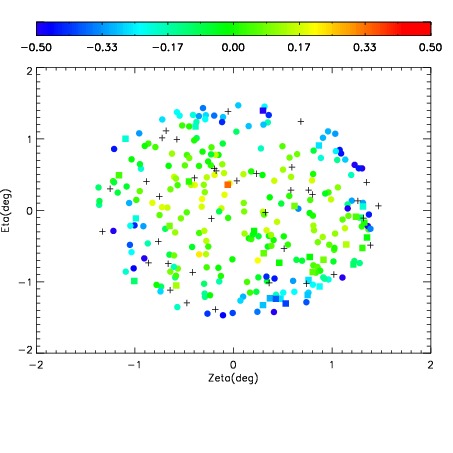
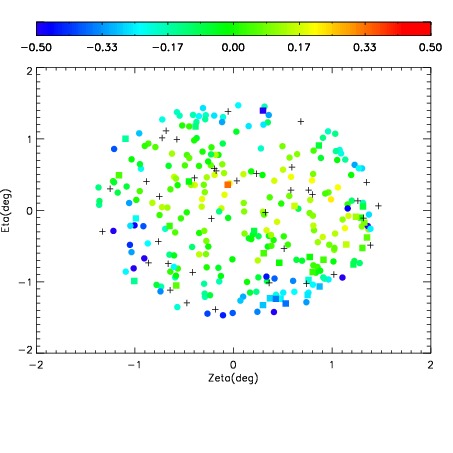
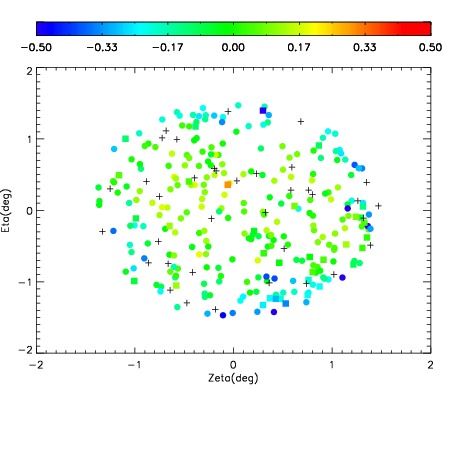
| Spatial mag deviation
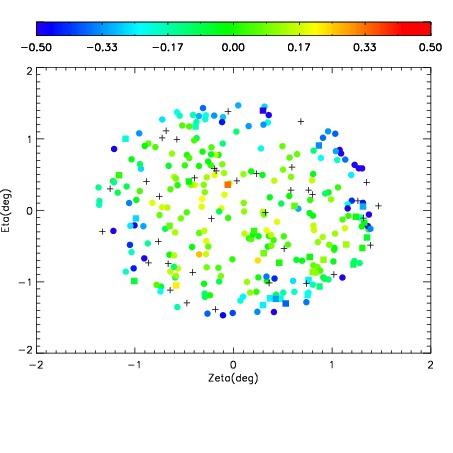
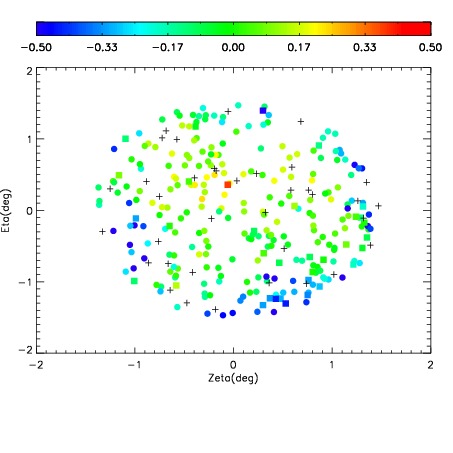
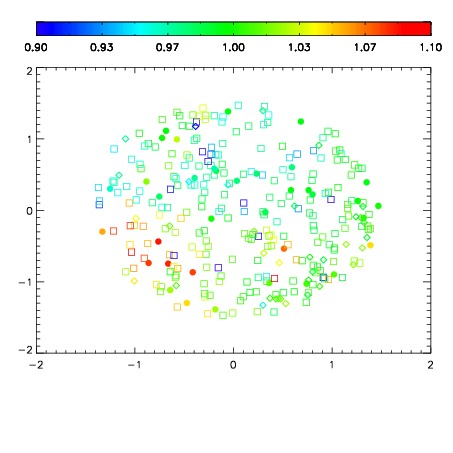
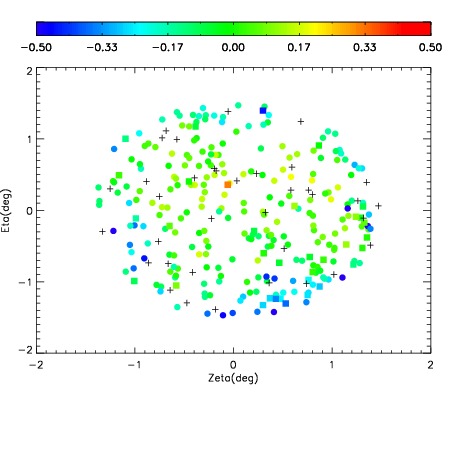
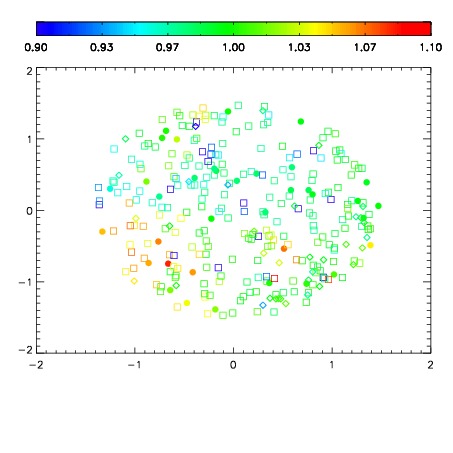
| Spatial sky 16325A emission deviations (filled: sky, open: star)
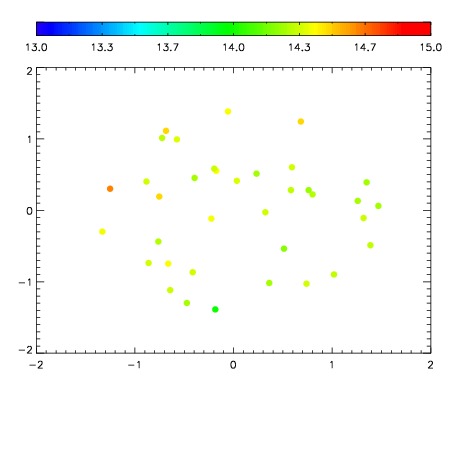
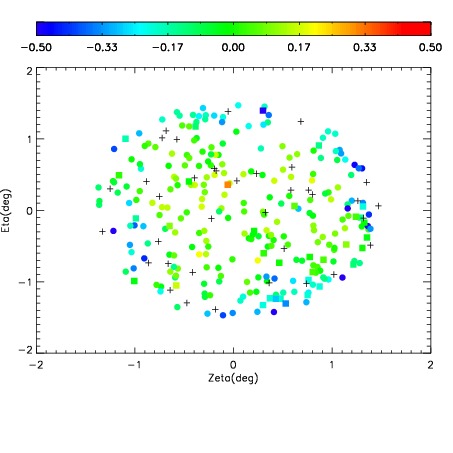
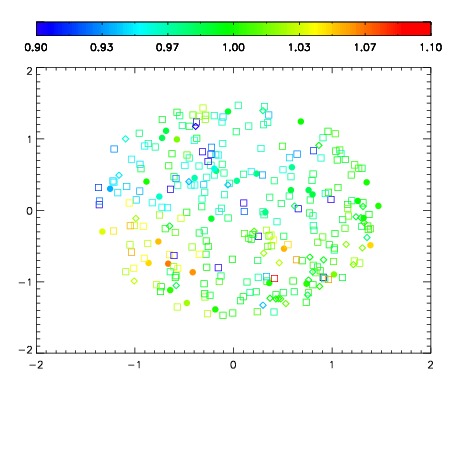
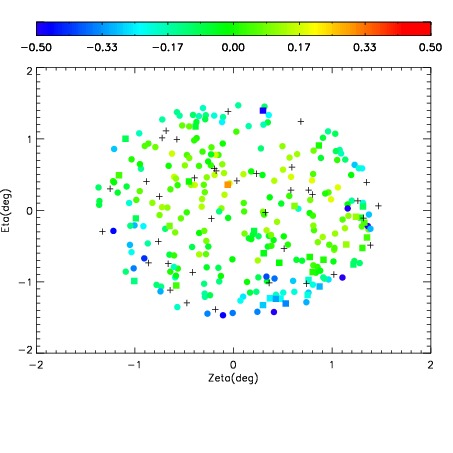
| Spatial sky continuum emission
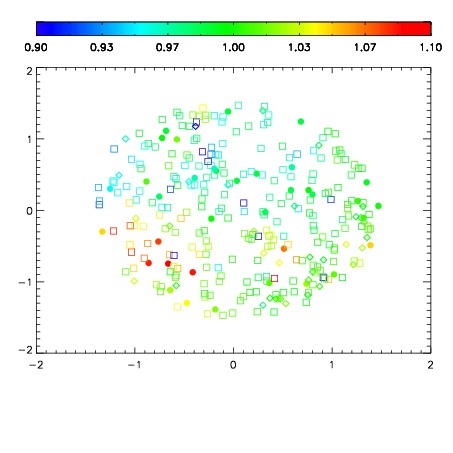
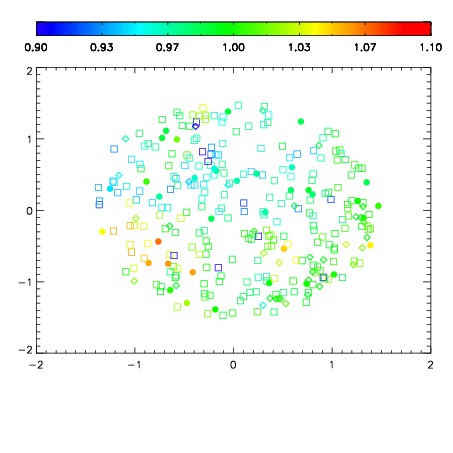
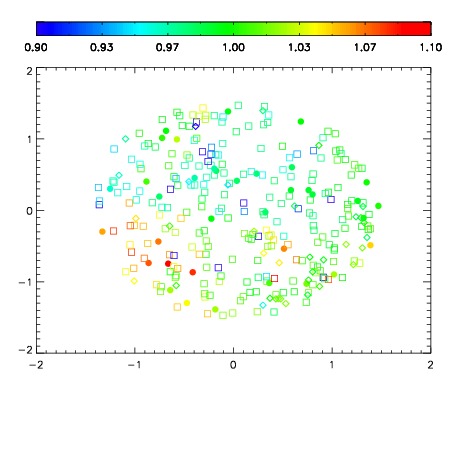
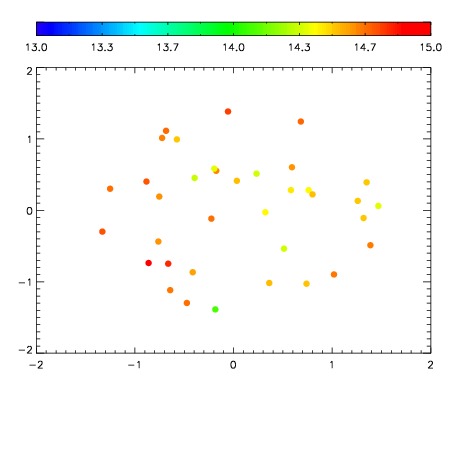
| Spatial sky telluric CO2 absorption deviations (filled: H < 10)
|
| 11960052
| 47
| | Red | Green | Blue
| | z | | 17.91
| | znorm | | 13.73
| | sky | 14.5 | 14.3 | 14.3
| | S/N | 7.2 | 12.3 | 13.4
| | S/N(c) | 6.1 | 11.0 | 12.1
| | SN(E/C) 1.00
|
| 
| 
| 
| 
| 
|
| 11960053
| 47
| | Red | Green | Blue
| | z | | 18.04
| | znorm | | 13.86
| | sky | 14.5 | 14.3 | 14.6
| | S/N | 7.6 | 13.3 | 14.8
| | S/N(c) | 6.4 | 11.8 | 13.1
| | SN(E/C) 0.96
|
| 
| 
| 
| 
| 
|
| 11960054
| 47
| | Red | Green | Blue
| | z | | 18.08
| | znorm | | 13.90
| | sky | 14.4 | 14.3 | 14.8
| | S/N | 7.9 | 13.8 | 15.1
| | S/N(c) | 6.9 | 12.4 | 13.4
| | SN(E/C) 0.98
|
| 
| 
| 
| 
| 
|
| 11960055
| 47
| | Red | Green | Blue
| | z | | 17.85
| | znorm | | 13.67
| | sky | 14.5 | 14.4 | 14.7
| | S/N | 6.2 | 11.4 | 12.9
| | S/N(c) | 5.3 | 10.1 | 11.3
| | SN(E/C) 1.01
|
| 
| 
| 
| 
| 
|
| 11960056
| 47
| | Red | Green | Blue
| | z | | 18.33
| | znorm | | 14.14
| | sky | 14.4 | 14.4 | 14.7
| | S/N | 9.7 | 16.1 | 17.4
| | S/N(c) | 8.4 | 14.4 | 15.6
| | SN(E/C) 0.99
|
| 
| 
| 
| 
| 
|
| 11960057
| 47
| | Red | Green | Blue
| | z | | 18.56
| | znorm | | 14.38
| | sky | 14.5 | 14.4 | 14.7
| | S/N | 11.5 | 18.7 | 19.9
| | S/N(c) | 9.8 | 17.1 | 18.1
| | SN(E/C) 0.97
|
| 
| 
| 
| 
| 
|
| 11960058
| 47
| | Red | Green | Blue
| | z | | 18.23
| | znorm | | 14.05
| | sky | 14.5 | 14.4 | 14.6
| | S/N | 8.4 | 15.0 | 16.0
| | S/N(c) | 7.2 | 13.4 | 14.3
| | SN(E/C) 1.01
|
| 
| 
| 
| 
| 
|
| 11960059
| 47
| | Red | Green | Blue
| | z | | 18.47
| | znorm | | 14.29
| | sky | 14.6 | 14.6 | 14.8
| | S/N | 10.6 | 17.6 | 18.5
| | S/N(c) | 9.1 | 15.8 | 16.8
| | SN(E/C) 0.97
|
| 
| 
| 
| 
| 
|
| 11960060
| 47
| | Red | Green | Blue
| | z | | 18.64
| | znorm | | 14.46
| | sky | 14.5 | 14.5 | 14.7
| | S/N | 12.2 | 19.7 | 20.6
| | S/N(c) | 10.8 | 18.0 | 18.9
| | SN(E/C) 0.99
|
| 
| 
| 
| 
| 
|
| 11960061
| 47
| | Red | Green | Blue
| | z | | 18.59
| | znorm | | 14.41
| | sky | 14.5 | 14.4 | 14.8
| | S/N | 11.4 | 18.5 | 20.0
| | S/N(c) | 9.9 | 17.0 | 18.0
| | SN(E/C) 1.00
|
| 
| 
| 
| 
| 
|