| Red | Green | Blue | |
| z | 17.64 | ||
| znorm | Inf | ||
| sky | -NaN | -NaN | -Inf |
| S/N | 18.4 | 32.1 | 34.5 |
| S/N(c) | 0.0 | 0.0 | 0.0 |
| SN(E/C) |
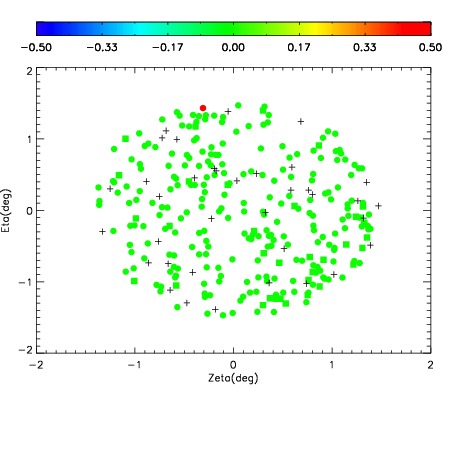
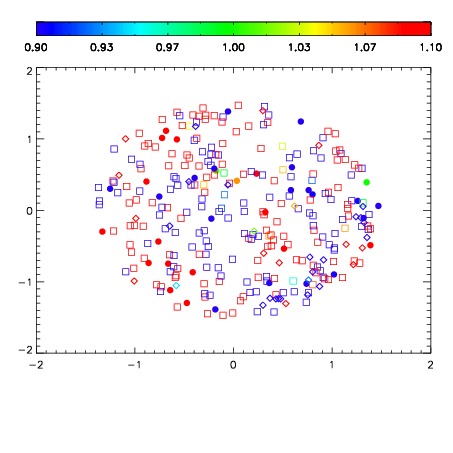
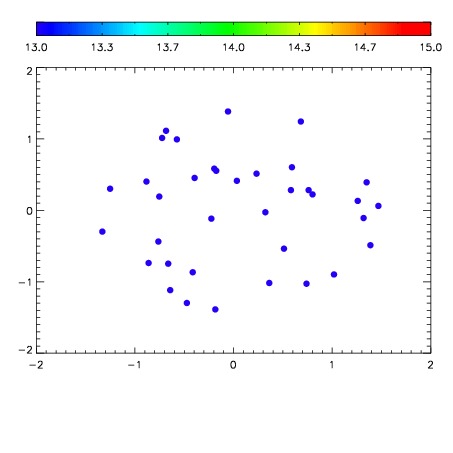

| Frame | Nreads | Zeropoints | Mag plots | Spatial mag deviation | Spatial sky 16325A emission deviations (filled: sky, open: star) | Spatial sky continuum emission | Spatial sky telluric CO2 absorption deviations (filled: H < 10) | |||||||||||||||||||||||
| 0 | 0 |
|
|
|
|
|
|
| IPAIR | NAME | SHIFT | NEWSHIFT | S/N | NAME | SHIFT | NEWSHIFT | S/N |
| 0 | 11960054 | 0.505216 | 0.00000 | 119.280 | 11960052 | 0.00000 | 0.505216 | 103.846 |
| 1 | 11960061 | 0.504229 | 0.000986993 | 156.886 | 11960060 | 0.00119490 | 0.504021 | 158.789 |
| 2 | 11960057 | 0.504920 | 0.000295997 | 154.134 | 11960059 | 0.000350506 | 0.504865 | 145.205 |
| 3 | 11960058 | 0.504965 | 0.000250995 | 131.301 | 11960056 | 0.00217718 | 0.503039 | 133.676 |
| 4 | 11960053 | 0.504185 | 0.00103098 | 117.044 | 11960055 | 0.00132680 | 0.503889 | 102.933 |