| Red | Green | Blue | |
| z | 17.64 | ||
| znorm | Inf | ||
| sky | -NaN | -NaN | -Inf |
| S/N | 27.1 | 41.5 | 48.8 |
| S/N(c) | 0.0 | 0.0 | 0.0 |
| SN(E/C) |
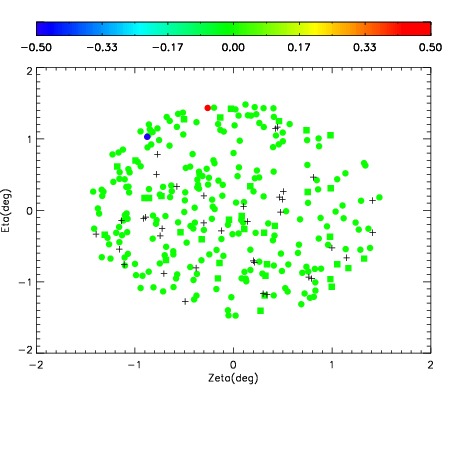
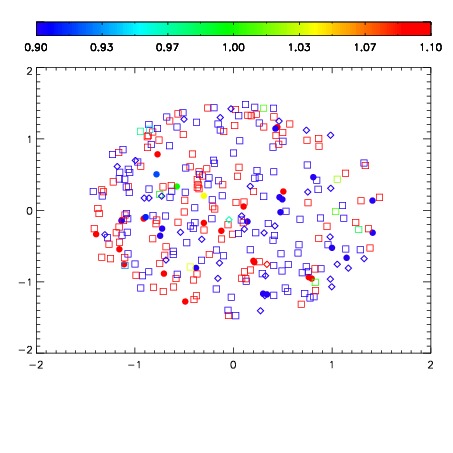
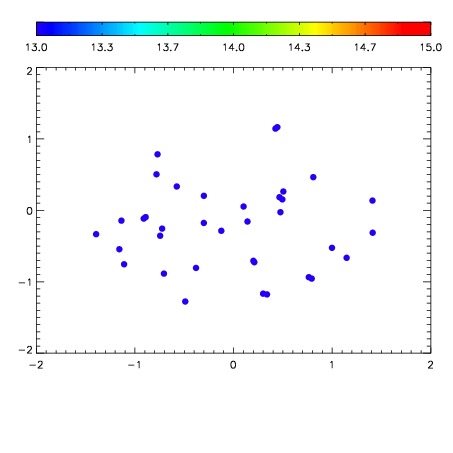

| Frame | Nreads | Zeropoints | Mag plots | Spatial mag deviation | Spatial sky 16325A emission deviations (filled: sky, open: star) | Spatial sky continuum emission | Spatial sky telluric CO2 absorption deviations (filled: H < 10) | |||||||||||||||||||||||
| 0 | 0 |
|
|
|
|
|
|
| IPAIR | NAME | SHIFT | NEWSHIFT | S/N | NAME | SHIFT | NEWSHIFT | S/N |
| 0 | 09030023 | 0.481583 | 0.00000 | 186.842 | 09030024 | 0.00505091 | 0.476532 | 190.307 |
| 1 | 09030019 | 0.480900 | 0.000683010 | 187.354 | 09030017 | 0.00000 | 0.481583 | 192.207 |
| 2 | 09030018 | 0.479959 | 0.00162399 | 186.384 | 09030021 | 0.00257016 | 0.479013 | 186.791 |
| 3 | 09030022 | 0.480619 | 0.000963986 | 185.461 | 09030020 | 0.00308843 | 0.478495 | 186.684 |