| Red | Green | Blue | |
| z | 17.64 | ||
| znorm | Inf | ||
| sky | -Inf | -Inf | -Inf |
| S/N | 22.9 | 38.4 | 37.9 |
| S/N(c) | 0.0 | 0.0 | 0.0 |
| SN(E/C) |
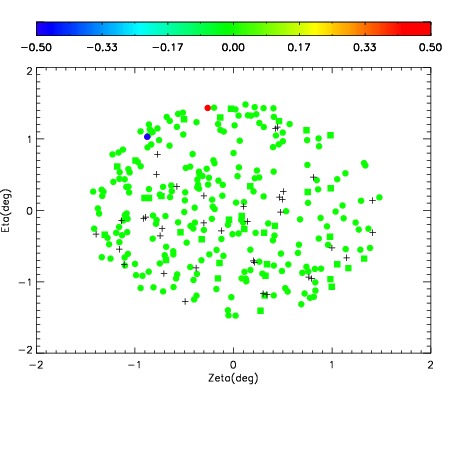
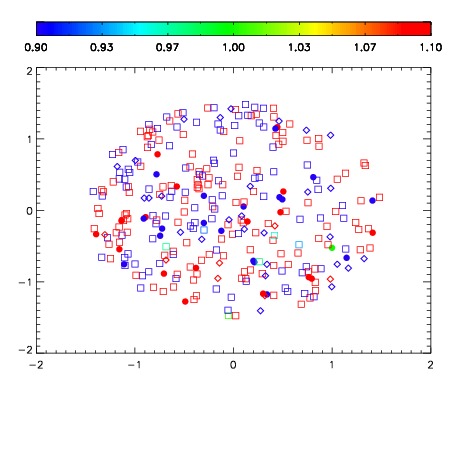
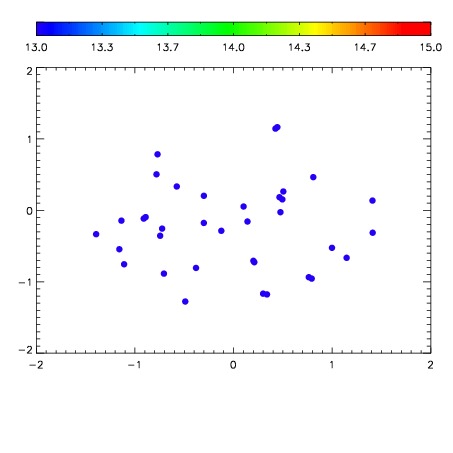

| Frame | Nreads | Zeropoints | Mag plots | Spatial mag deviation | Spatial sky 16325A emission deviations (filled: sky, open: star) | Spatial sky continuum emission | Spatial sky telluric CO2 absorption deviations (filled: H < 10) | |||||||||||||||||||||||
| 0 | 0 |
|
|
|
|
|
|
| IPAIR | NAME | SHIFT | NEWSHIFT | S/N | NAME | SHIFT | NEWSHIFT | S/N |
| 0 | 09100028 | 0.484166 | 0.00000 | 184.828 | 09100022 | 0.00000 | 0.484166 | 188.128 |
| 1 | 09100027 | 0.481928 | 0.00223801 | 210.391 | 09100029 | 0.00224853 | 0.481917 | 205.640 |
| 2 | 09100024 | 0.476027 | 0.00813898 | 201.057 | 09100025 | 0.00419260 | 0.479973 | 201.922 |
| 3 | 09100023 | 0.475505 | 0.00866100 | 199.600 | 09100026 | 0.00437771 | 0.479788 | 199.776 |