| Red | Green | Blue | |
| z | 17.64 | ||
| znorm | Inf | ||
| sky | -NaN | -NaN | -Inf |
| S/N | 14.9 | 24.9 | 24.3 |
| S/N(c) | 0.0 | 0.0 | 0.0 |
| SN(E/C) |
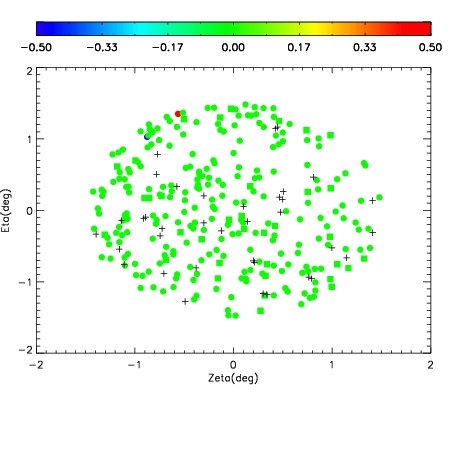
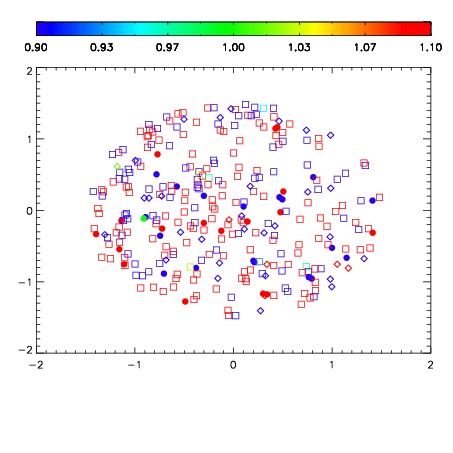


| Frame | Nreads | Zeropoints | Mag plots | Spatial mag deviation | Spatial sky 16325A emission deviations (filled: sky, open: star) | Spatial sky continuum emission | Spatial sky telluric CO2 absorption deviations (filled: H < 10) | |||||||||||||||||||||||
| 0 | 0 |
|
|
|
|
|
|
| IPAIR | NAME | SHIFT | NEWSHIFT | S/N | NAME | SHIFT | NEWSHIFT | S/N |
| 0 | 09750013 | 0.512064 | 0.00000 | 177.116 | 09750014 | 0.00241316 | 0.509651 | 175.488 |
| 1 | 09750012 | 0.511769 | 0.000294983 | 163.049 | 09750011 | 0.00000 | 0.512064 | 159.969 |