| Red | Green | Blue | |
| z | 17.64 | ||
| znorm | Inf | ||
| sky | -NaN | -Inf | -Inf |
| S/N | 24.5 | 38.5 | 41.5 |
| S/N(c) | 0.0 | 0.0 | 0.0 |
| SN(E/C) |
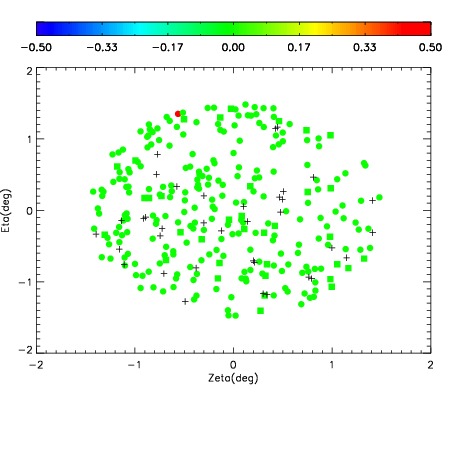
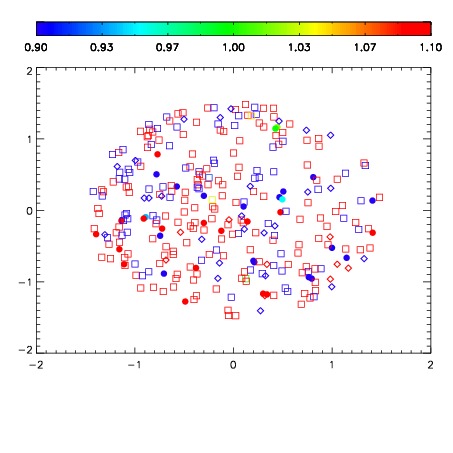
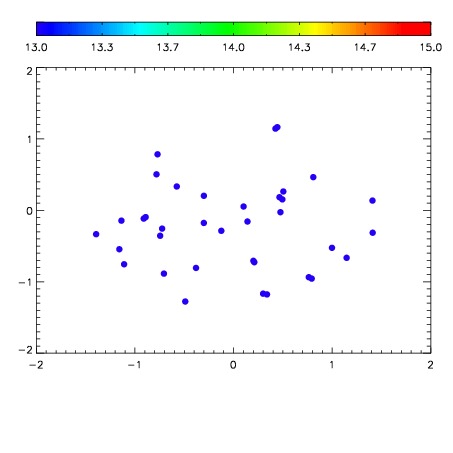

| Frame | Nreads | Zeropoints | Mag plots | Spatial mag deviation | Spatial sky 16325A emission deviations (filled: sky, open: star) | Spatial sky continuum emission | Spatial sky telluric CO2 absorption deviations (filled: H < 10) | |||||||||||||||||||||||
| 0 | 0 |
|
|
|
|
|
|
| IPAIR | NAME | SHIFT | NEWSHIFT | S/N | NAME | SHIFT | NEWSHIFT | S/N |
| 0 | 09770028 | 0.513321 | 0.00000 | 190.031 | 09770029 | 0.000382038 | 0.512939 | 188.553 |
| 1 | 09770027 | 0.512251 | 0.00106996 | 188.796 | 09770026 | 0.00000 | 0.513321 | 188.085 |
| 2 | 09770031 | 0.512071 | 0.00124997 | 187.363 | 09770033 | -0.000195648 | 0.513517 | 186.205 |
| 3 | 09770032 | 0.512400 | 0.000921011 | 186.462 | 09770030 | -0.000195730 | 0.513517 | 176.984 |