| Red | Green | Blue | |
| z | 17.64 | ||
| znorm | Inf | ||
| sky | -NaN | -Inf | -Inf |
| S/N | 26.8 | 42.9 | 45.6 |
| S/N(c) | 0.0 | 0.0 | 0.0 |
| SN(E/C) |
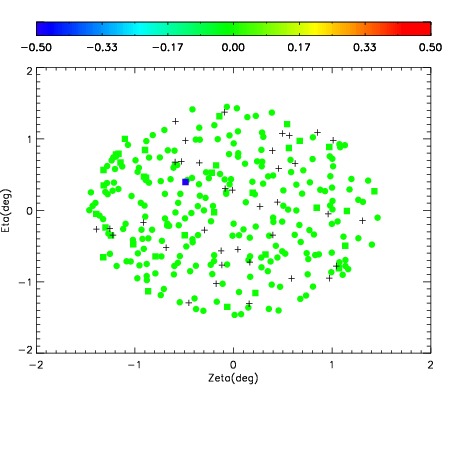
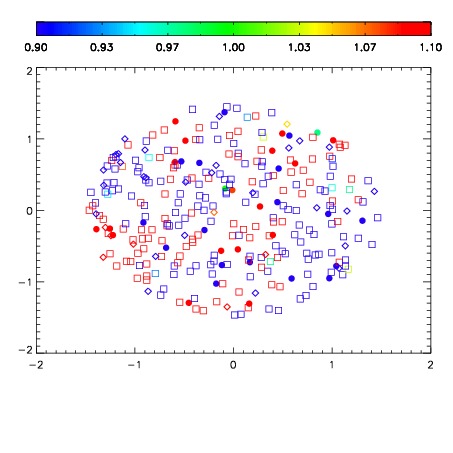
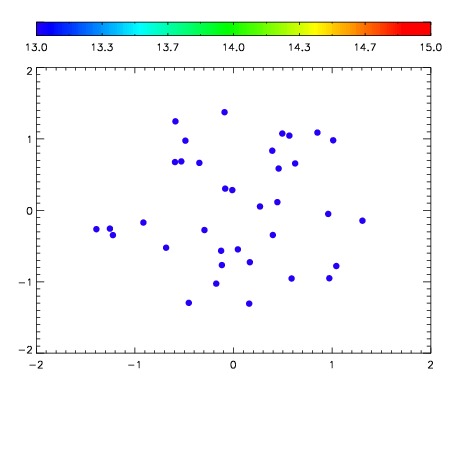

| Frame | Nreads | Zeropoints | Mag plots | Spatial mag deviation | Spatial sky 16325A emission deviations (filled: sky, open: star) | Spatial sky continuum emission | Spatial sky telluric CO2 absorption deviations (filled: H < 10) | |||||||||||||||||||||||
| 0 | 0 |
|
|
|
|
|
|
| IPAIR | NAME | SHIFT | NEWSHIFT | S/N | NAME | SHIFT | NEWSHIFT | S/N |
| 0 | 09040057 | 0.481325 | 0.00000 | 199.244 | 09040055 | 0.00000 | 0.481325 | 189.222 |
| 1 | 09040056 | 0.480458 | 0.000867009 | 201.998 | 09040058 | 0.00288239 | 0.478443 | 196.071 |
| 2 | 09040060 | 0.480176 | 0.00114900 | 184.517 | 09040059 | 0.00329430 | 0.478031 | 187.020 |
| 3 | 09040061 | 0.480929 | 0.000396013 | 178.826 | 09040062 | 0.00334631 | 0.477979 | 178.694 |