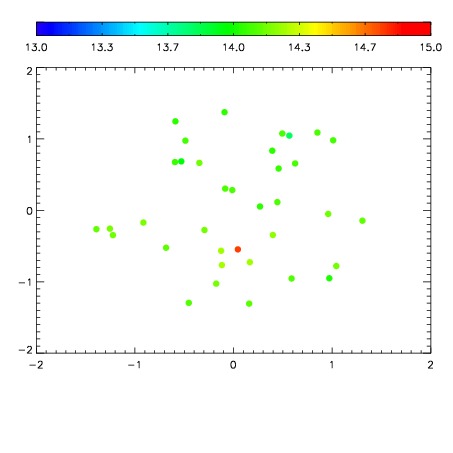
| Frame | Nreads | Zeropoints | Mag plots
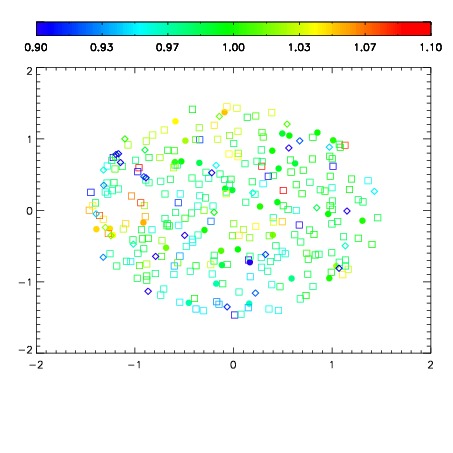
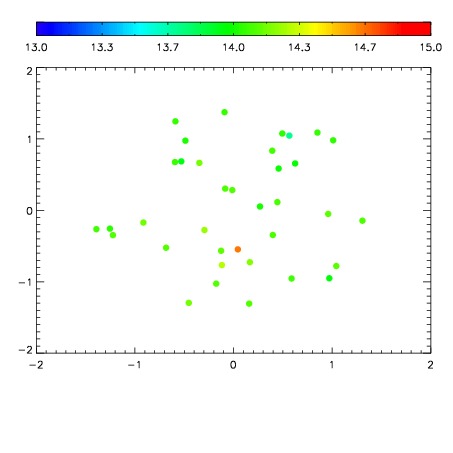
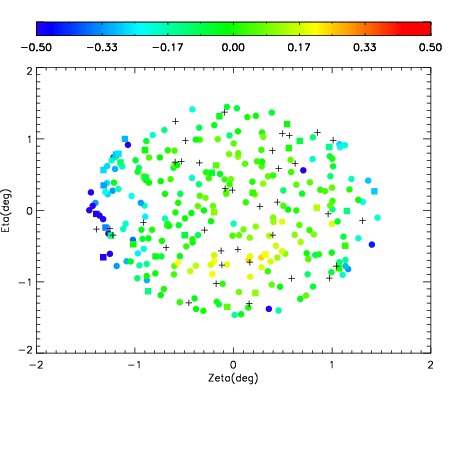
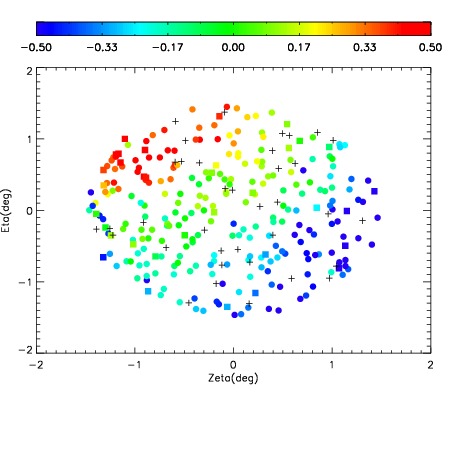
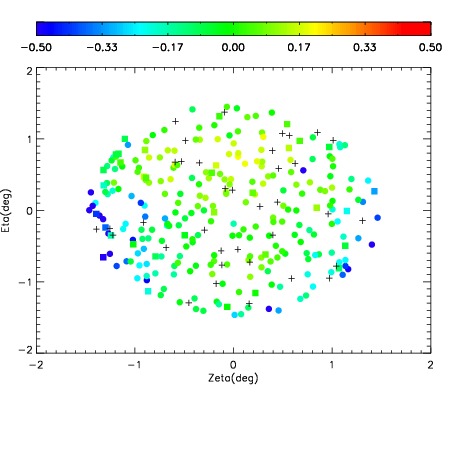
| Spatial mag deviation
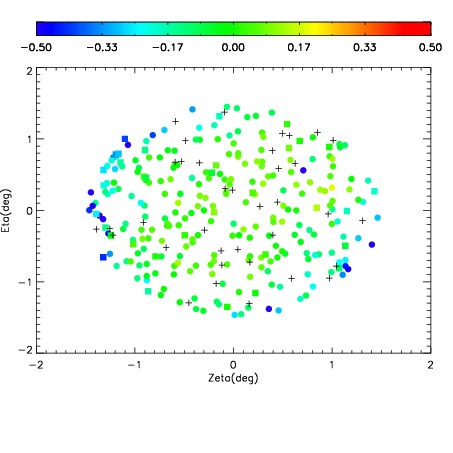
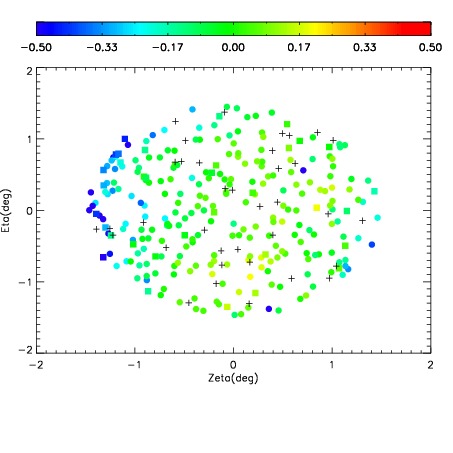
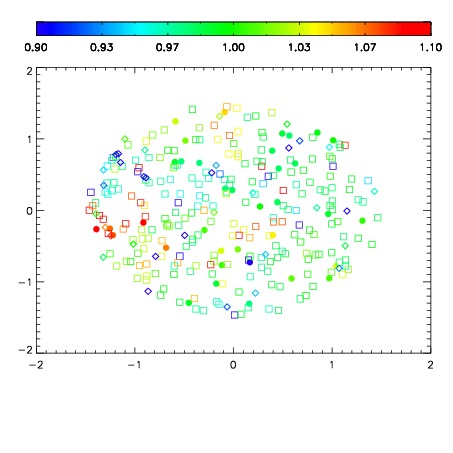
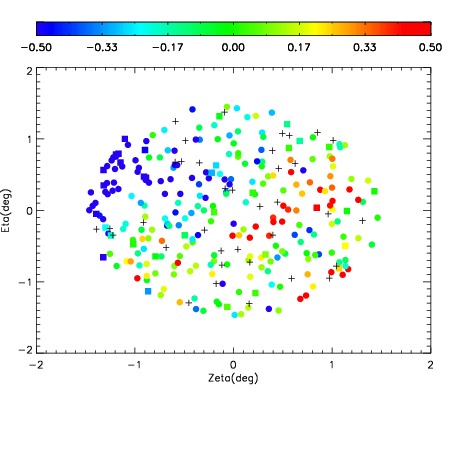
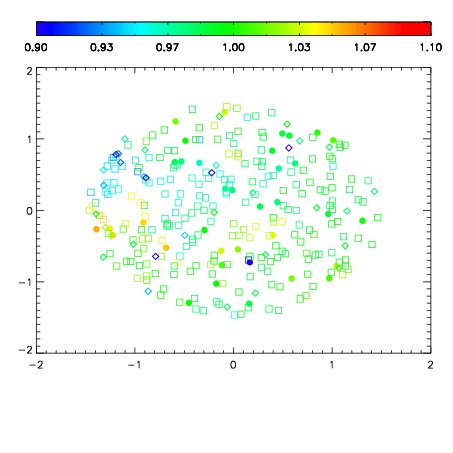
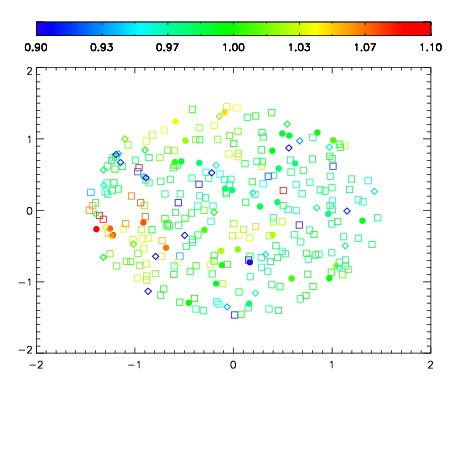
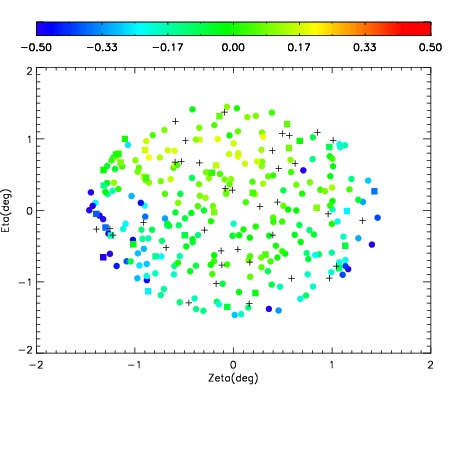
| Spatial sky 16325A emission deviations (filled: sky, open: star)
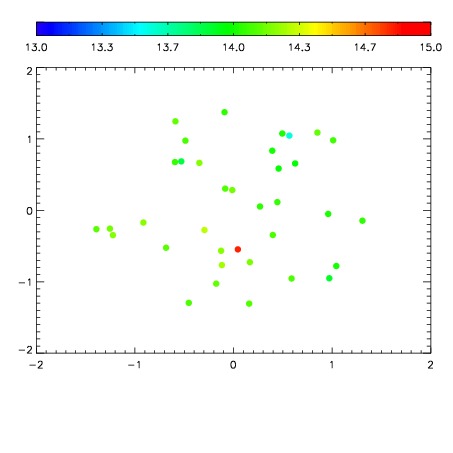
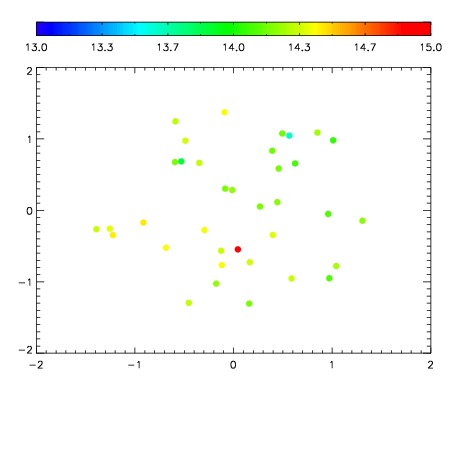
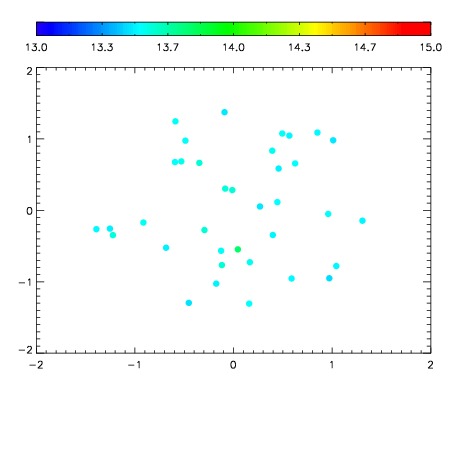
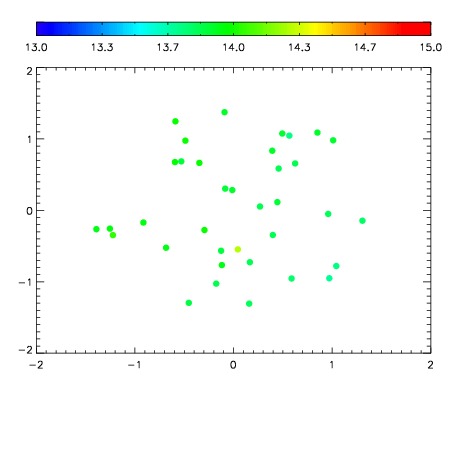
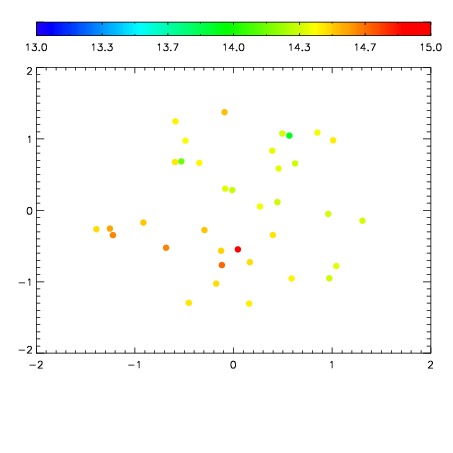
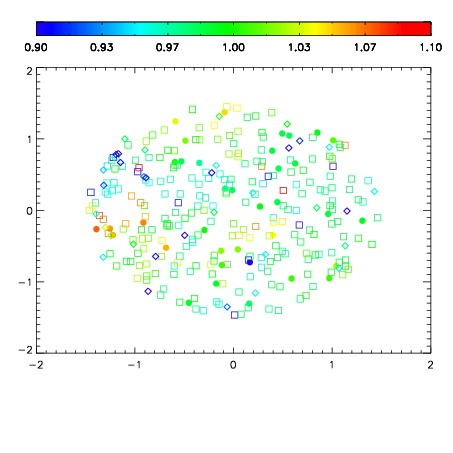
| Spatial sky continuum emission
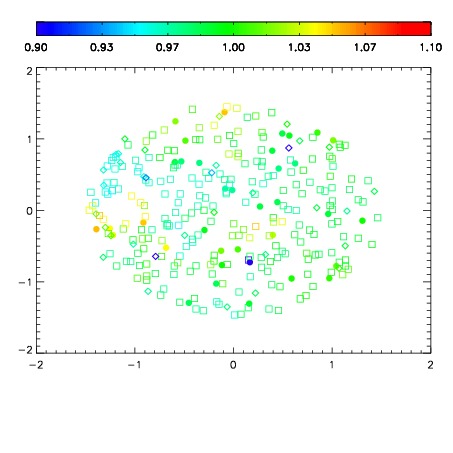
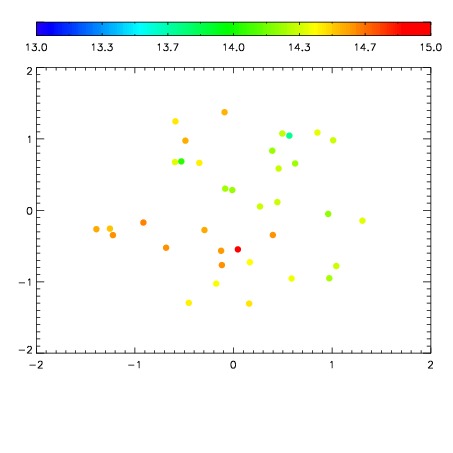
| Spatial sky telluric CO2 absorption deviations (filled: H < 10)
|
| 9100033
| 47
| | Red | Green | Blue
| | z | | 18.74
| | znorm | | 14.56
| | sky | 14.4 | 14.1 | 14.2
| | S/N | 12.3 | 20.0 | 20.7
| | S/N(c) | 10.9 | 18.8 | 19.0
| | SN(E/C) 0.87
|
| 
| 
| 
| 
| 
|
| 9100034
| 47
| | Red | Green | Blue
| | z | | 18.27
| | znorm | | 14.09
| | sky | 14.3 | 14.1 | 14.4
| | S/N | 8.3 | 14.3 | 15.2
| | S/N(c) | 7.3 | 13.2 | 13.6
| | SN(E/C) 0.95
|
| 
| 
| 
| 
| 
|
| 9100035
| 47
| | Red | Green | Blue
| | z | | 18.87
| | znorm | | 14.69
| | sky | 14.5 | 14.3 | 14.4
| | S/N | 13.7 | 20.9 | 22.1
| | S/N(c) | 12.1 | 19.5 | 20.4
| | SN(E/C) 0.86
|
| 
| 
| 
| 
| 
|
| 9100036
| 47
| | Red | Green | Blue
| | z | | 18.07
| | znorm | | 13.89
| | sky | 14.2 | 14.1 | 14.2
| | S/N | 7.3 | 12.3 | 13.0
| | S/N(c) | 6.3 | 11.3 | 12.0
| | SN(E/C) 0.98
|
| 
| 
| 
| 
| 
|
| 9100037
| 47
| | Red | Green | Blue
| | z | | 15.07
| | znorm | | 10.89
| | sky | 13.6 | 13.5 | 13.8
| | S/N | 0.4 | 1.0 | 0.8
| | S/N(c) | 0.5 | 0.9 | 0.8
| | SN(E/C) 0.94
|
| 
| 
| 
| 
| 
|
| 9100038
| 47
| | Red | Green | Blue
| | z | | 16.79
| | znorm | | 12.61
| | sky | 13.9 | 13.9 | 14.1
| | S/N | 2.4 | 5.0 | 5.0
| | S/N(c) | 2.3 | 4.5 | 5.0
| | SN(E/C) 0.96
|
| 
| 
| 
| 
| 
|
| 9100039
| 47
| | Red | Green | Blue
| | z | | 18.26
| | znorm | | 14.08
| | sky | 14.5 | 14.4 | 14.5
| | S/N | 8.6 | 14.8 | 15.1
| | S/N(c) | 7.3 | 13.4 | 14.0
| | SN(E/C) 0.89
|
| 
| 
| 
| 
| 
|
| 9100040
| 47
| | Red | Green | Blue
| | z | | 18.69
| | znorm | | 14.51
| | sky | 14.4 | 14.4 | 14.4
| | S/N | 11.7 | 19.2 | 19.5
| | S/N(c) | 10.3 | 17.8 | 18.1
| | SN(E/C) 0.86
|
| 
| 
| 
| 
| 
|