| Red | Green | Blue | |
| z | 17.64 | ||
| znorm | Inf | ||
| sky | -Inf | -Inf | -Inf |
| S/N | 26.4 | 44.6 | 48.5 |
| S/N(c) | 0.0 | 0.0 | 0.0 |
| SN(E/C) |
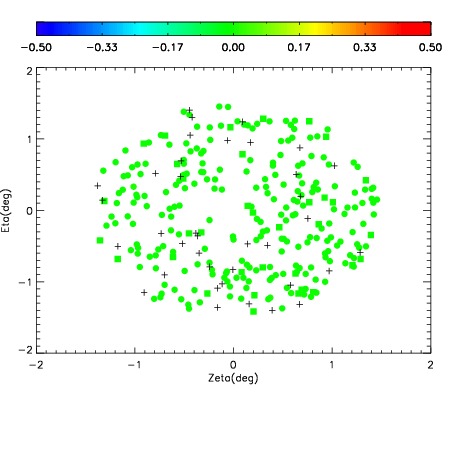
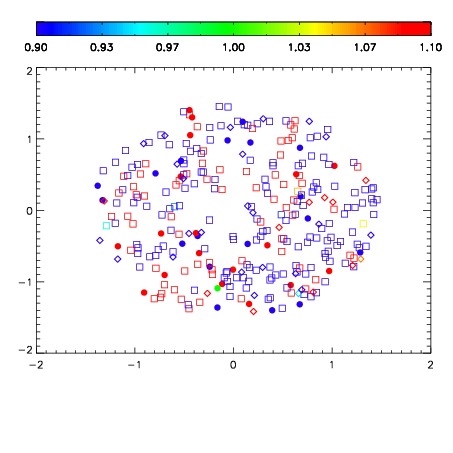
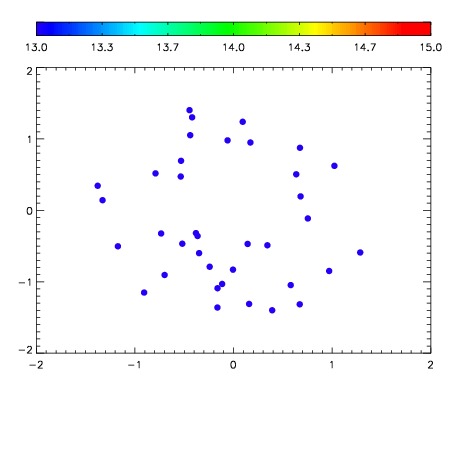

| Frame | Nreads | Zeropoints | Mag plots | Spatial mag deviation | Spatial sky 16325A emission deviations (filled: sky, open: star) | Spatial sky continuum emission | Spatial sky telluric CO2 absorption deviations (filled: H < 10) | |||||||||||||||||||||||
| 0 | 0 |
|
|
|
|
|
|
| IPAIR | NAME | SHIFT | NEWSHIFT | S/N | NAME | SHIFT | NEWSHIFT | S/N |
| 0 | 09050042 | 0.480899 | 0.00000 | 212.637 | 09050043 | 0.000616420 | 0.480283 | 213.056 |
| 1 | 09050041 | 0.480715 | 0.000184000 | 212.175 | 09050039 | 0.00170954 | 0.479189 | 208.929 |
| 2 | 09050038 | 0.479166 | 0.00173301 | 195.115 | 09050040 | 0.00186370 | 0.479035 | 198.826 |
| 3 | 09050037 | 0.480156 | 0.000743002 | 177.062 | 09050036 | 0.00000 | 0.480899 | 183.072 |