| Red | Green | Blue | |
| z | 17.64 | ||
| znorm | Inf | ||
| sky | -Inf | -Inf | -Inf |
| S/N | 15.5 | 28.0 | 30.5 |
| S/N(c) | 0.0 | 0.0 | 0.0 |
| SN(E/C) |
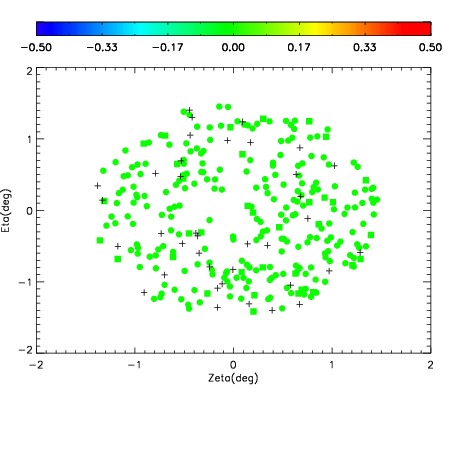
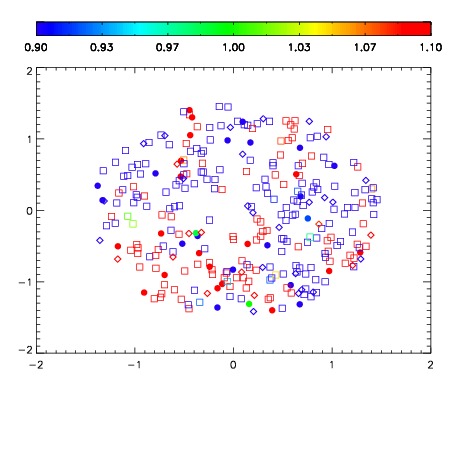
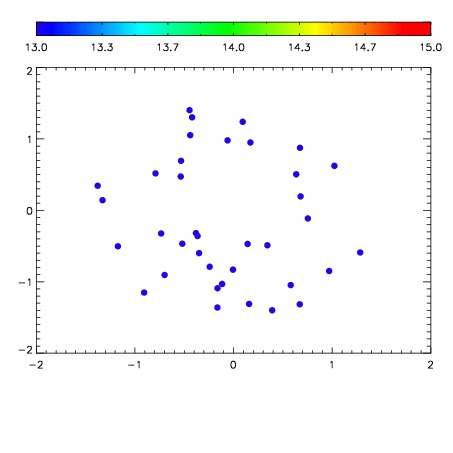

| Frame | Nreads | Zeropoints | Mag plots | Spatial mag deviation | Spatial sky 16325A emission deviations (filled: sky, open: star) | Spatial sky continuum emission | Spatial sky telluric CO2 absorption deviations (filled: H < 10) | |||||||||||||||||||||||
| 0 | 0 |
|
|
|
|
|
|
| IPAIR | NAME | SHIFT | NEWSHIFT | S/N | NAME | SHIFT | NEWSHIFT | S/N |
| 0 | 09090034 | 0.484739 | 0.00000 | 100.085 | 09090040 | 0.00853832 | 0.476201 | 30.5969 |
| 1 | 09090038 | 0.478472 | 0.00626701 | 162.784 | 09090033 | 0.00000 | 0.484739 | 198.147 |
| 2 | 09090035 | 0.483779 | 0.000959992 | 142.317 | 09090037 | 0.00356585 | 0.481173 | 171.338 |
| 3 | 09090039 | 0.480514 | 0.00422502 | 140.800 | 09090036 | 0.00463766 | 0.480101 | 149.729 |