| Red | Green | Blue | |
| z | 17.64 | ||
| znorm | Inf | ||
| sky | -Inf | -Inf | -Inf |
| S/N | 30.4 | 50.1 | 55.2 |
| S/N(c) | 0.0 | 0.0 | 0.0 |
| SN(E/C) |
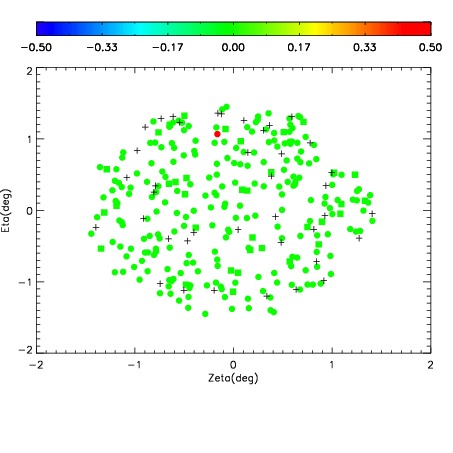
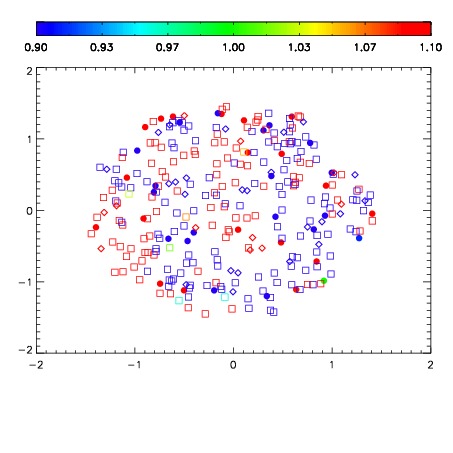
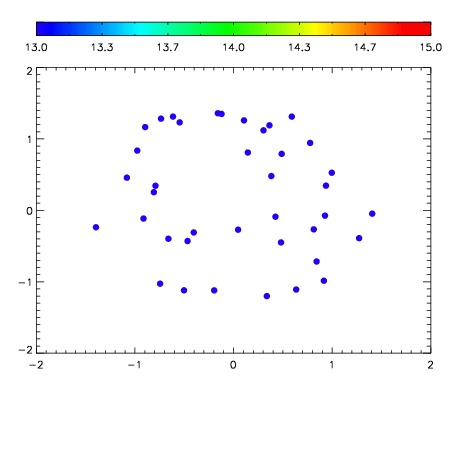

| Frame | Nreads | Zeropoints | Mag plots | Spatial mag deviation | Spatial sky 16325A emission deviations (filled: sky, open: star) | Spatial sky continuum emission | Spatial sky telluric CO2 absorption deviations (filled: H < 10) | |||||||||||||||||||||||
| 0 | 0 |
|
|
|
|
|
|
| IPAIR | NAME | SHIFT | NEWSHIFT | S/N | NAME | SHIFT | NEWSHIFT | S/N |
| 0 | 10210017 | 0.493659 | 0.00000 | 216.250 | 10210011 | 0.00000 | 0.493659 | 215.365 |
| 1 | 10210012 | 0.493128 | 0.000530988 | 218.690 | 10210015 | 0.00334926 | 0.490310 | 217.433 |
| 2 | 10210013 | 0.492646 | 0.00101298 | 218.022 | 10210014 | 0.00276319 | 0.490896 | 216.507 |
| 3 | 10210016 | 0.493027 | 0.000631988 | 210.061 | 10210018 | 0.00334160 | 0.490317 | 213.112 |