| Red | Green | Blue | |
| z | 17.64 | ||
| znorm | Inf | ||
| sky | -Inf | -Inf | -Inf |
| S/N | 24.0 | 40.2 | 45.9 |
| S/N(c) | 0.0 | 0.0 | 0.0 |
| SN(E/C) |

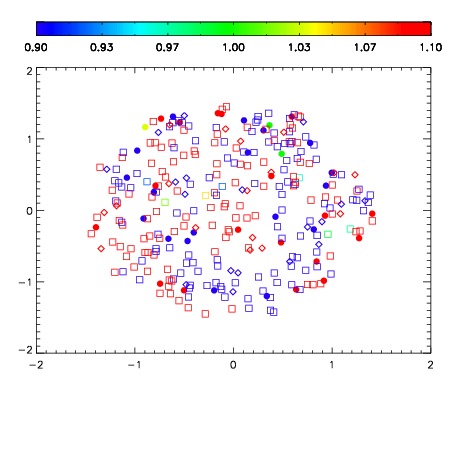
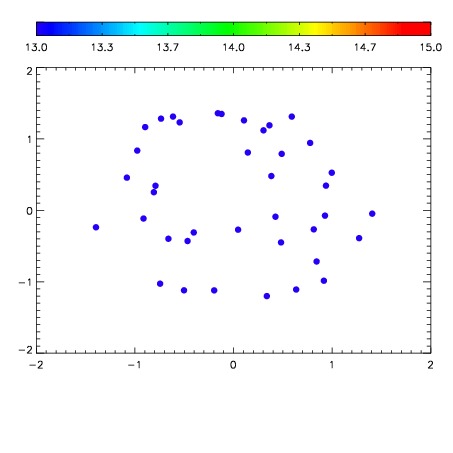

| Frame | Nreads | Zeropoints | Mag plots | Spatial mag deviation | Spatial sky 16325A emission deviations (filled: sky, open: star) | Spatial sky continuum emission | Spatial sky telluric CO2 absorption deviations (filled: H < 10) | |||||||||||||||||||||||
| 0 | 0 |
|
|
|
|
|
|
| IPAIR | NAME | SHIFT | NEWSHIFT | S/N | NAME | SHIFT | NEWSHIFT | S/N |
| 0 | 10250017 | 0.500780 | 0.00000 | 192.129 | 10250018 | -0.00234098 | 0.503121 | 207.113 |
| 1 | 10250012 | 0.497738 | 0.00304198 | 232.022 | 10250011 | 0.00000 | 0.500780 | 233.207 |
| 2 | 10250013 | 0.498535 | 0.00224498 | 205.782 | 10250015 | -0.00410426 | 0.504884 | 215.384 |
| 3 | 10250016 | 0.499711 | 0.00106898 | 202.441 | 10250014 | -0.00417342 | 0.504953 | 210.158 |