| Red | Green | Blue | |
| z | 17.64 | ||
| znorm | Inf | ||
| sky | -Inf | -Inf | -Inf |
| S/N | 25.9 | 45.3 | 50.8 |
| S/N(c) | 0.0 | 0.0 | 0.0 |
| SN(E/C) |
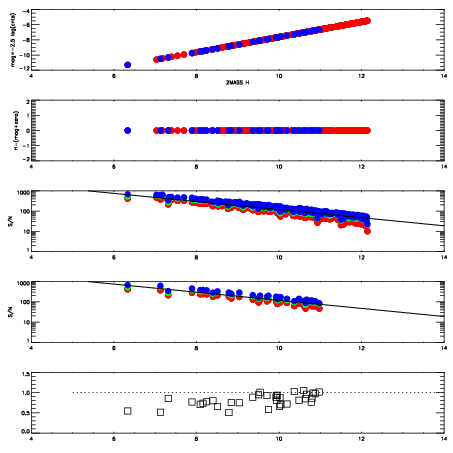
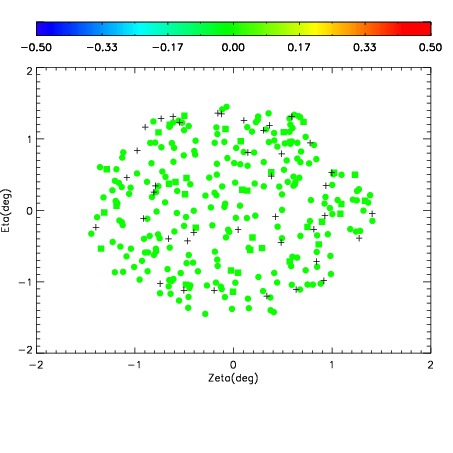
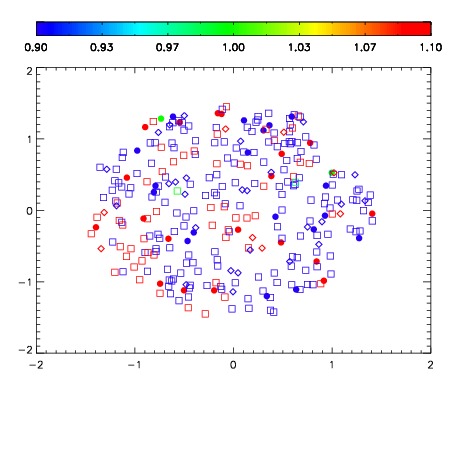
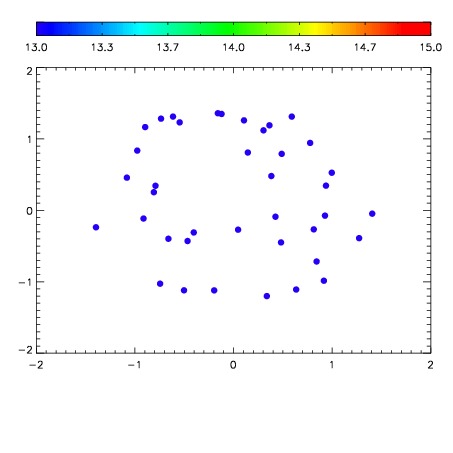

| Frame | Nreads | Zeropoints | Mag plots | Spatial mag deviation | Spatial sky 16325A emission deviations (filled: sky, open: star) | Spatial sky continuum emission | Spatial sky telluric CO2 absorption deviations (filled: H < 10) | |||||||||||||||||||||||
| 0 | 0 |
|
|
|
|
|
|
| IPAIR | NAME | SHIFT | NEWSHIFT | S/N | NAME | SHIFT | NEWSHIFT | S/N |
| 0 | 10490029 | 0.499056 | 0.00000 | 187.850 | 10490028 | 0.00000 | 0.499056 | 202.872 |
| 1 | 10490033 | 0.498575 | 0.000481009 | 209.487 | 10490032 | -0.00102157 | 0.500078 | 210.780 |
| 2 | 10490030 | 0.498883 | 0.000173002 | 208.806 | 10490035 | -0.000867469 | 0.499923 | 209.860 |
| 3 | 10490034 | 0.498848 | 0.000208020 | 207.387 | 10490031 | -0.000841392 | 0.499897 | 208.111 |