| Red | Green | Blue | |
| z | 17.64 | ||
| znorm | Inf | ||
| sky | -Inf | -Inf | -Inf |
| S/N | 24.8 | 42.4 | 46.2 |
| S/N(c) | 0.0 | 0.0 | 0.0 |
| SN(E/C) |
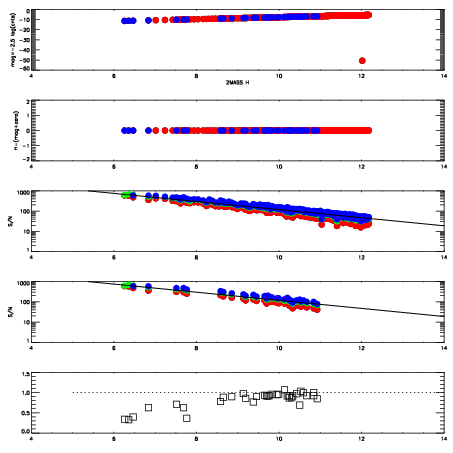
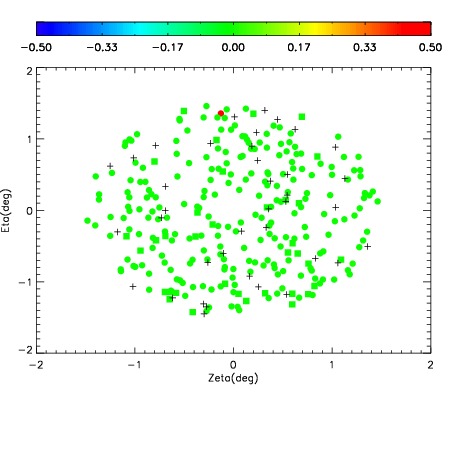
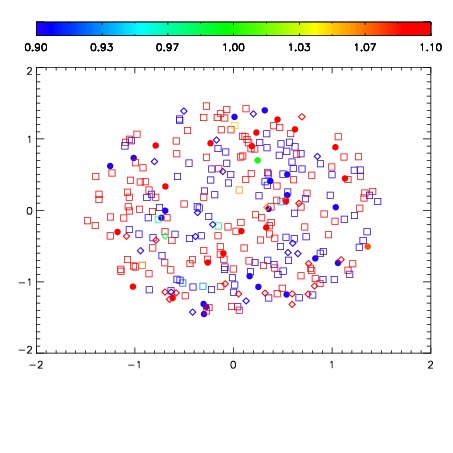
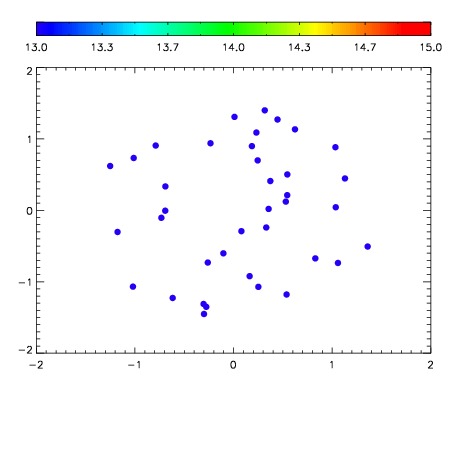

| Frame | Nreads | Zeropoints | Mag plots | Spatial mag deviation | Spatial sky 16325A emission deviations (filled: sky, open: star) | Spatial sky continuum emission | Spatial sky telluric CO2 absorption deviations (filled: H < 10) | |||||||||||||||||||||||
| 0 | 0 |
|
|
|
|
|
|
| IPAIR | NAME | SHIFT | NEWSHIFT | S/N | NAME | SHIFT | NEWSHIFT | S/N |
| 0 | 03100034 | 0.496342 | 0.00000 | 222.048 | 03100036 | -0.00443720 | 0.500779 | 213.649 |
| 1 | 03100033 | 0.496121 | 0.000221014 | 222.652 | 03100032 | 0.00000 | 0.496342 | 219.359 |
| 2 | 03100038 | 0.493184 | 0.00315800 | 211.711 | 03100039 | -0.00188165 | 0.498224 | 208.135 |
| 3 | 03100037 | 0.492553 | 0.00378901 | 209.310 | 03100035 | -0.00382608 | 0.500168 | 196.697 |