| Red | Green | Blue | |
| z | 17.64 | ||
| znorm | Inf | ||
| sky | -Inf | -Inf | -Inf |
| S/N | 27.1 | 45.6 | 48.0 |
| S/N(c) | 0.0 | 0.0 | 0.0 |
| SN(E/C) |
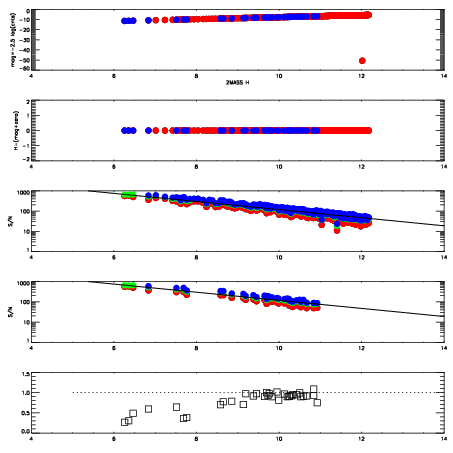

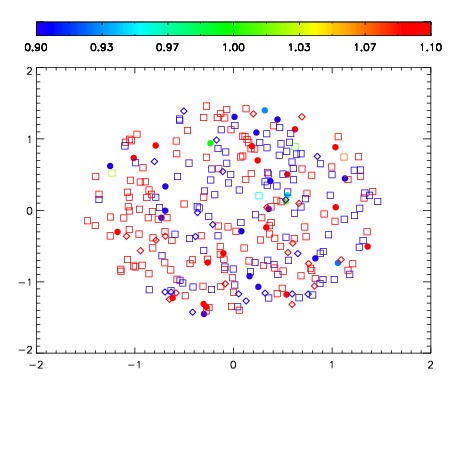
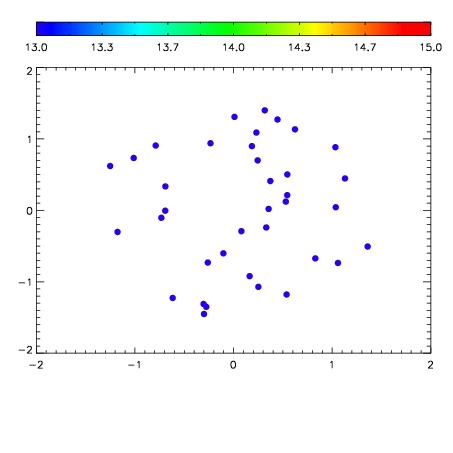

| Frame | Nreads | Zeropoints | Mag plots | Spatial mag deviation | Spatial sky 16325A emission deviations (filled: sky, open: star) | Spatial sky continuum emission | Spatial sky telluric CO2 absorption deviations (filled: H < 10) | |||||||||||||||||||||||
| 0 | 0 |
|
|
|
|
|
|
| IPAIR | NAME | SHIFT | NEWSHIFT | S/N | NAME | SHIFT | NEWSHIFT | S/N |
| 0 | 03410014 | 0.506087 | 0.00000 | 225.158 | 03410015 | 0.00286787 | 0.503219 | 227.385 |
| 1 | 03410010 | 0.505783 | 0.000303984 | 220.582 | 03410011 | 0.00190101 | 0.504186 | 223.253 |
| 2 | 03410013 | 0.499840 | 0.00624701 | 220.129 | 03410012 | 0.00209849 | 0.503989 | 220.586 |
| 3 | 03410009 | 0.499617 | 0.00646999 | 212.854 | 03410008 | 0.00000 | 0.506087 | 124.743 |