| Red | Green | Blue | |
| z | 17.64 | ||
| znorm | Inf | ||
| sky | -Inf | -Inf | -Inf |
| S/N | 22.3 | 39.4 | 41.6 |
| S/N(c) | 0.0 | 0.0 | 0.0 |
| SN(E/C) |
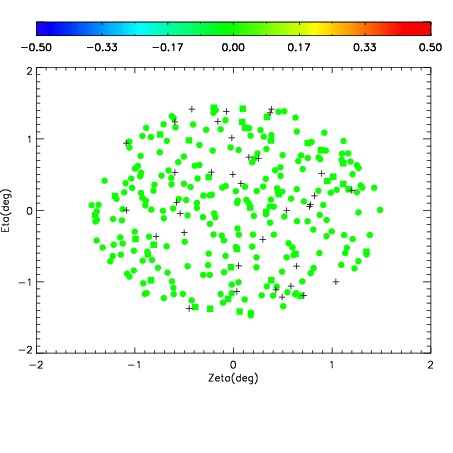
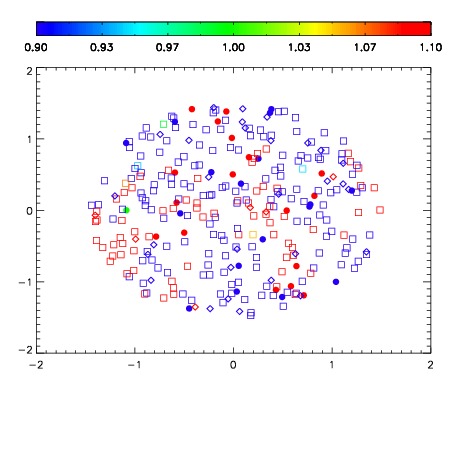
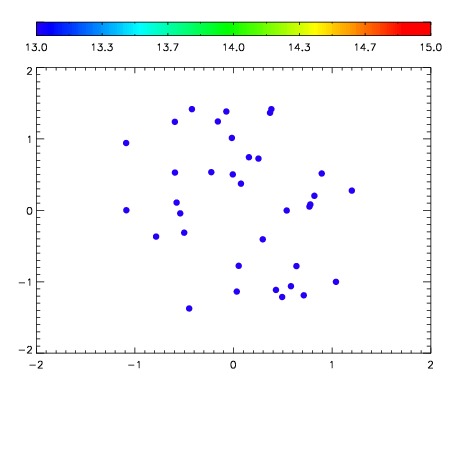

| Frame | Nreads | Zeropoints | Mag plots | Spatial mag deviation | Spatial sky 16325A emission deviations (filled: sky, open: star) | Spatial sky continuum emission | Spatial sky telluric CO2 absorption deviations (filled: H < 10) | |||||||||||||||||||||||
| 0 | 0 |
|
|
|
|
|
|
| IPAIR | NAME | SHIFT | NEWSHIFT | S/N | NAME | SHIFT | NEWSHIFT | S/N |
| 0 | 02820063 | 0.413533 | 0.00000 | 179.631 | 02820064 | 0.000924309 | 0.412609 | 183.233 |
| 1 | 02820062 | 0.411176 | 0.00235701 | 190.679 | 02820061 | -0.00159851 | 0.415132 | 186.791 |
| 2 | 02820059 | 0.412659 | 0.000874013 | 175.775 | 02820060 | -0.000975092 | 0.414508 | 180.599 |
| 3 | 02820058 | 0.410586 | 0.00294700 | 154.203 | 02820057 | 0.00000 | 0.413533 | 145.364 |