| Red | Green | Blue | |
| z | 17.64 | ||
| znorm | Inf | ||
| sky | -Inf | -Inf | -Inf |
| S/N | 26.1 | 43.0 | 49.1 |
| S/N(c) | 0.0 | 0.0 | 0.0 |
| SN(E/C) |
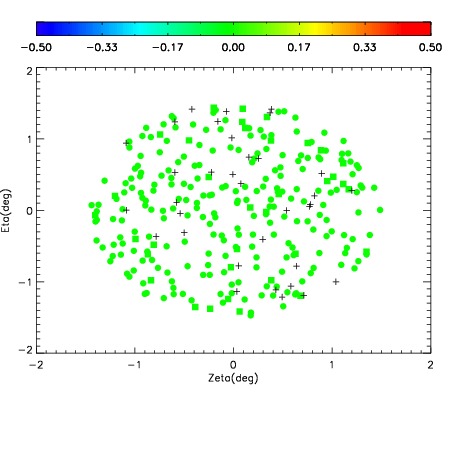
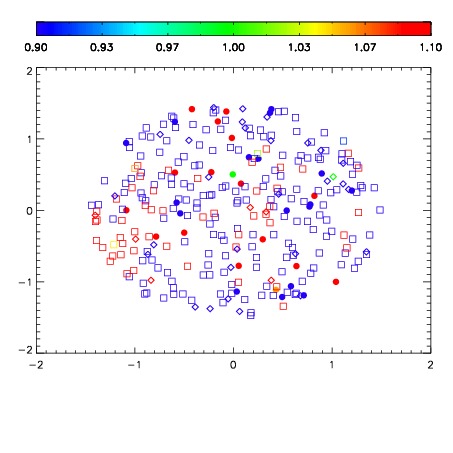
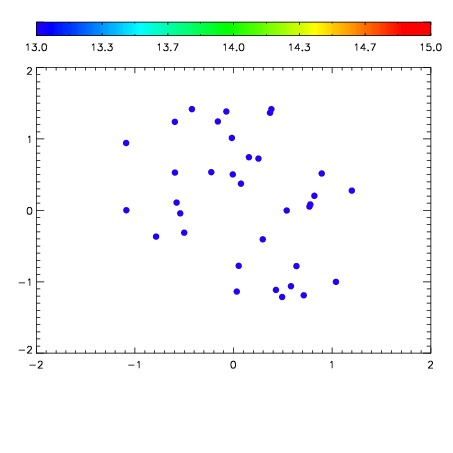

| Frame | Nreads | Zeropoints | Mag plots | Spatial mag deviation | Spatial sky 16325A emission deviations (filled: sky, open: star) | Spatial sky continuum emission | Spatial sky telluric CO2 absorption deviations (filled: H < 10) | |||||||||||||||||||||||
| 0 | 0 |
|
|
|
|
|
|
| IPAIR | NAME | SHIFT | NEWSHIFT | S/N | NAME | SHIFT | NEWSHIFT | S/N |
| 0 | 02880051 | 0.406917 | 0.00000 | 189.074 | 02880053 | -0.00207116 | 0.408988 | 184.525 |
| 1 | 02880054 | 0.402489 | 0.00442800 | 192.386 | 02880049 | 0.00000 | 0.406917 | 188.663 |
| 2 | 02880050 | 0.405920 | 0.000997007 | 189.534 | 02880056 | -0.00101311 | 0.407930 | 185.332 |
| 3 | 02880055 | 0.404466 | 0.00245100 | 184.586 | 02880052 | 0.000351890 | 0.406565 | 178.259 |