| Red | Green | Blue | |
| z | 17.64 | ||
| znorm | Inf | ||
| sky | -Inf | -Inf | -Inf |
| S/N | 23.5 | 40.7 | 44.8 |
| S/N(c) | 0.0 | 0.0 | 0.0 |
| SN(E/C) |
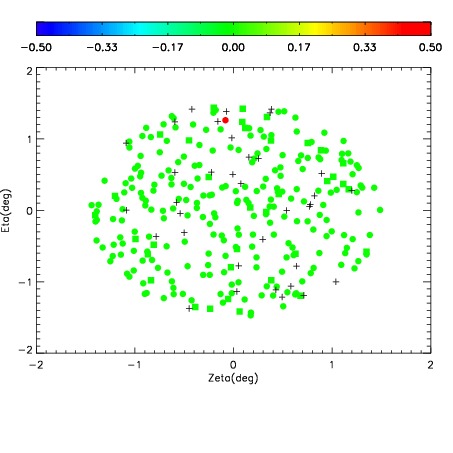
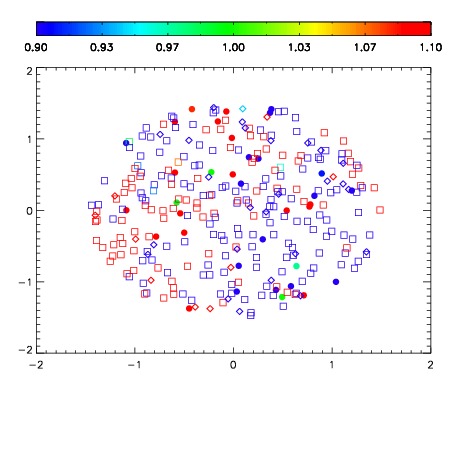
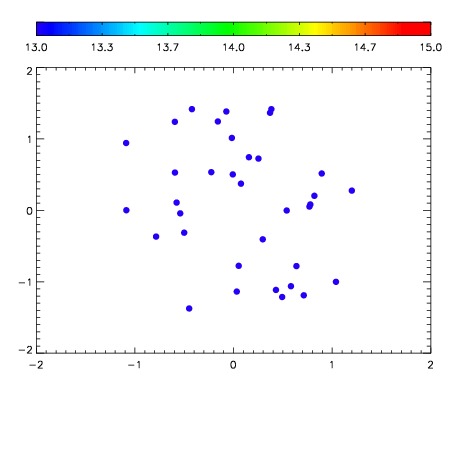

| Frame | Nreads | Zeropoints | Mag plots | Spatial mag deviation | Spatial sky 16325A emission deviations (filled: sky, open: star) | Spatial sky continuum emission | Spatial sky telluric CO2 absorption deviations (filled: H < 10) | |||||||||||||||||||||||
| 0 | 0 |
|
|
|
|
|
|
| IPAIR | NAME | SHIFT | NEWSHIFT | S/N | NAME | SHIFT | NEWSHIFT | S/N |
| 0 | 03090047 | 0.486142 | 0.00000 | 182.813 | 03090048 | 0.00215969 | 0.483982 | 175.228 |
| 1 | 03090051 | 0.486048 | 9.39965e-05 | 178.657 | 03090052 | 0.00268574 | 0.483456 | 173.763 |
| 2 | 03090050 | 0.485464 | 0.000678003 | 178.573 | 03090045 | 0.00000 | 0.486142 | 173.733 |
| 3 | 03090046 | 0.485453 | 0.000689000 | 176.914 | 03090049 | 0.000207632 | 0.485934 | 171.720 |