| Red | Green | Blue | |
| z | 17.64 | ||
| znorm | Inf | ||
| sky | -Inf | -Inf | -Inf |
| S/N | 27.4 | 49.0 | 55.7 |
| S/N(c) | 0.0 | 0.0 | 0.0 |
| SN(E/C) |
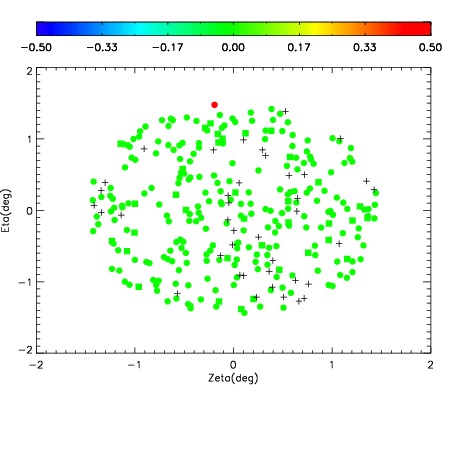
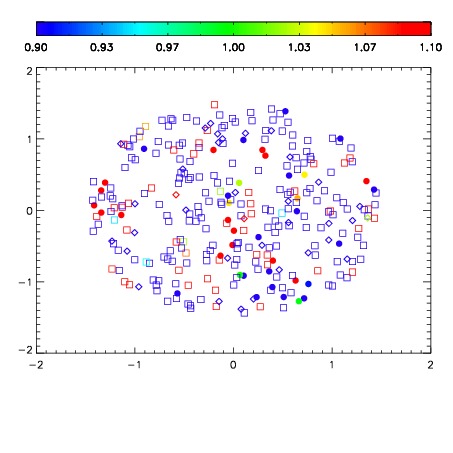
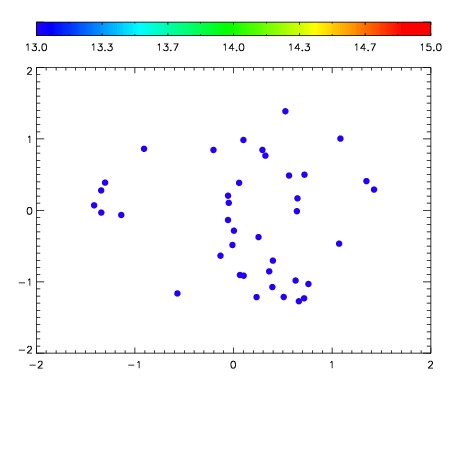

| Frame | Nreads | Zeropoints | Mag plots | Spatial mag deviation | Spatial sky 16325A emission deviations (filled: sky, open: star) | Spatial sky continuum emission | Spatial sky telluric CO2 absorption deviations (filled: H < 10) | |||||||||||||||||||||||
| 0 | 0 |
|
|
|
|
|
|
| IPAIR | NAME | SHIFT | NEWSHIFT | S/N | NAME | SHIFT | NEWSHIFT | S/N |
| 0 | 02890089 | 0.402891 | 0.00000 | 228.300 | 02890087 | -0.000976792 | 0.403868 | 230.215 |
| 1 | 02890092 | 0.401177 | 0.00171402 | 235.897 | 02890091 | -0.000774711 | 0.403666 | 238.572 |
| 2 | 02890088 | 0.400338 | 0.00255302 | 231.523 | 02890090 | 0.00175436 | 0.401137 | 234.420 |
| 3 | 02890085 | 0.402407 | 0.000484020 | 222.570 | 02890086 | 0.00188283 | 0.401008 | 229.215 |
| 4 | 02890084 | 0.400788 | 0.00210300 | 218.453 | 02890083 | 0.00000 | 0.402891 | 225.904 |