| Red | Green | Blue | |
| z | 17.64 | ||
| znorm | Inf | ||
| sky | -Inf | -Inf | -Inf |
| S/N | 26.2 | 45.4 | 49.7 |
| S/N(c) | 0.0 | 0.0 | 0.0 |
| SN(E/C) |
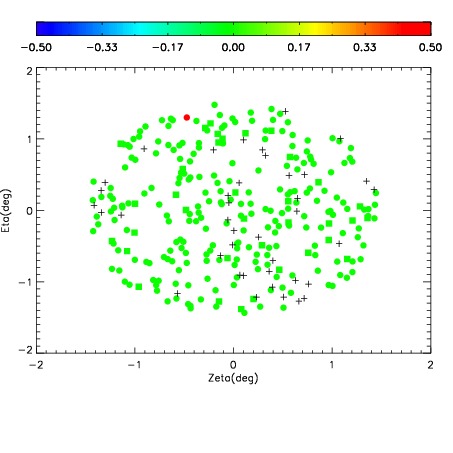
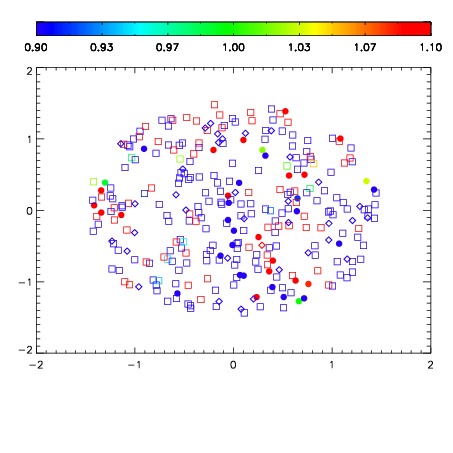


| Frame | Nreads | Zeropoints | Mag plots | Spatial mag deviation | Spatial sky 16325A emission deviations (filled: sky, open: star) | Spatial sky continuum emission | Spatial sky telluric CO2 absorption deviations (filled: H < 10) | |||||||||||||||||||||||
| 0 | 0 |
|
|
|
|
|
|
| IPAIR | NAME | SHIFT | NEWSHIFT | S/N | NAME | SHIFT | NEWSHIFT | S/N |
| 0 | 02910040 | 0.397037 | 0.00000 | 265.224 | 02910038 | 0.00000 | 0.397037 | 262.868 |
| 1 | 02910044 | 0.393116 | 0.00392100 | 270.160 | 02910045 | 0.000507463 | 0.396530 | 271.745 |
| 2 | 02910043 | 0.393117 | 0.00391999 | 264.403 | 02910042 | -0.000722796 | 0.397760 | 249.996 |
| 3 | 02910039 | 0.396944 | 9.30130e-05 | 264.131 | 02910041 | 0.000973445 | 0.396064 | 229.651 |