| Red | Green | Blue | |
| z | 17.64 | ||
| znorm | Inf | ||
| sky | -Inf | -Inf | -Inf |
| S/N | 19.6 | 36.6 | 40.9 |
| S/N(c) | 0.0 | 0.0 | 0.0 |
| SN(E/C) |
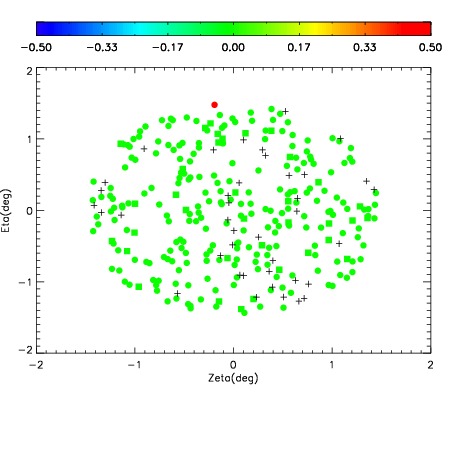
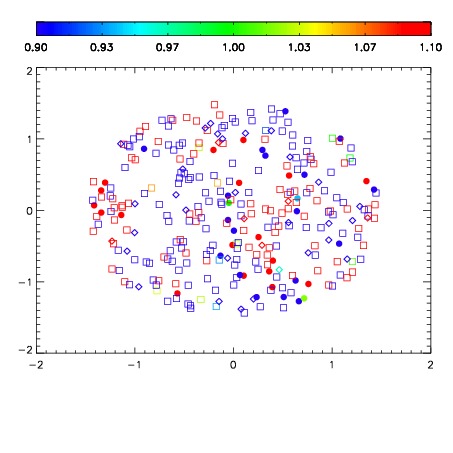


| Frame | Nreads | Zeropoints | Mag plots | Spatial mag deviation | Spatial sky 16325A emission deviations (filled: sky, open: star) | Spatial sky continuum emission | Spatial sky telluric CO2 absorption deviations (filled: H < 10) | |||||||||||||||||||||||
| 0 | 0 |
|
|
|
|
|
|
| IPAIR | NAME | SHIFT | NEWSHIFT | S/N | NAME | SHIFT | NEWSHIFT | S/N |
| 0 | 03070062 | 0.505952 | 0.00000 | 179.487 | 03070056 | 0.00000 | 0.505952 | 159.912 |
| 1 | 03070057 | 0.503998 | 0.00195402 | 208.528 | 03070060 | 0.00342176 | 0.502530 | 206.726 |
| 2 | 03070058 | 0.504659 | 0.00129300 | 203.076 | 03070063 | 0.00574116 | 0.500211 | 195.516 |
| 3 | 03070061 | 0.504677 | 0.00127500 | 179.748 | 03070059 | 0.00692921 | 0.499023 | 190.670 |