| Red | Green | Blue | |
| z | 17.64 | ||
| znorm | Inf | ||
| sky | -Inf | -Inf | -Inf |
| S/N | 27.0 | 45.5 | 52.0 |
| S/N(c) | 0.0 | 0.0 | 0.0 |
| SN(E/C) |
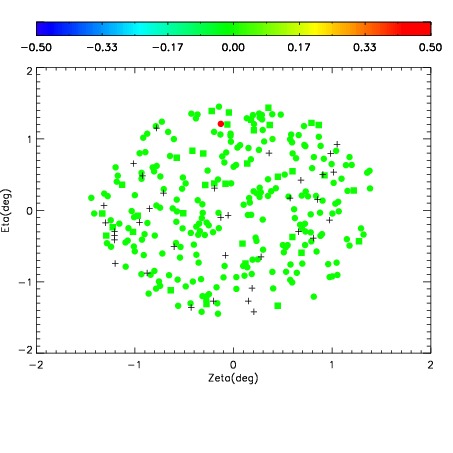
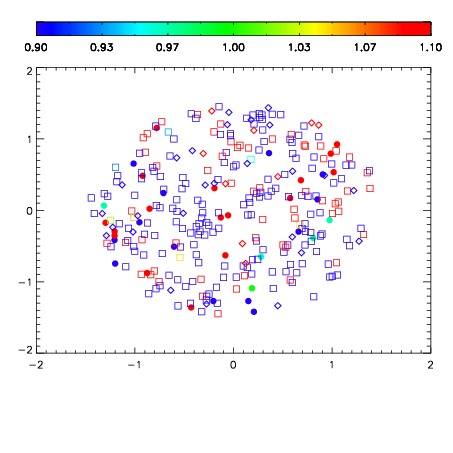
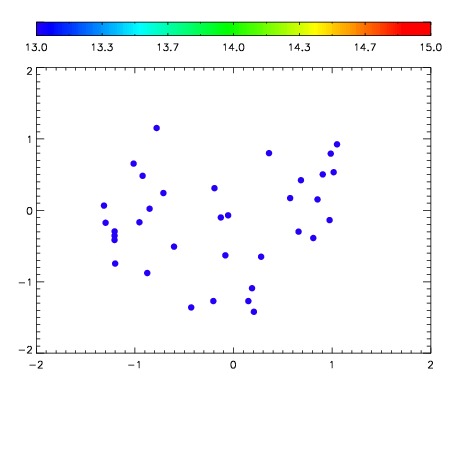

| Frame | Nreads | Zeropoints | Mag plots | Spatial mag deviation | Spatial sky 16325A emission deviations (filled: sky, open: star) | Spatial sky continuum emission | Spatial sky telluric CO2 absorption deviations (filled: H < 10) | |||||||||||||||||||||||
| 0 | 0 |
|
|
|
|
|
|
| IPAIR | NAME | SHIFT | NEWSHIFT | S/N | NAME | SHIFT | NEWSHIFT | S/N |
| 0 | 02900064 | 0.399774 | 0.00000 | 228.122 | 02900065 | 0.00179890 | 0.397975 | 222.282 |
| 1 | 02900059 | 0.396910 | 0.00286397 | 230.125 | 02900058 | 0.00000 | 0.399774 | 230.500 |
| 2 | 02900063 | 0.397192 | 0.00258198 | 229.361 | 02900061 | 0.00270671 | 0.397067 | 228.983 |
| 3 | 02900060 | 0.399335 | 0.000438988 | 229.131 | 02900062 | 0.000544347 | 0.399230 | 224.240 |