| Red | Green | Blue | |
| z | 17.64 | ||
| znorm | Inf | ||
| sky | -NaN | -Inf | -Inf |
| S/N | 24.3 | 44.0 | 46.8 |
| S/N(c) | 0.0 | 0.0 | 0.0 |
| SN(E/C) |
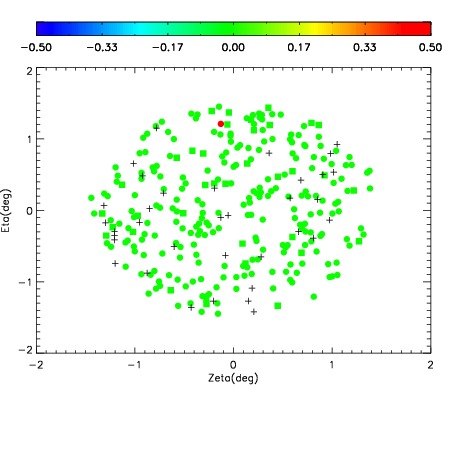
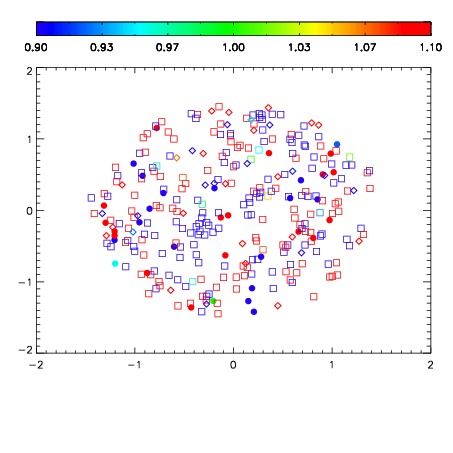
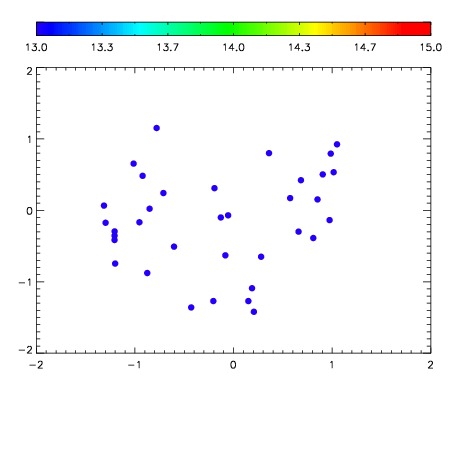

| Frame | Nreads | Zeropoints | Mag plots | Spatial mag deviation | Spatial sky 16325A emission deviations (filled: sky, open: star) | Spatial sky continuum emission | Spatial sky telluric CO2 absorption deviations (filled: H < 10) | |||||||||||||||||||||||
| 0 | 0 |
|
|
|
|
|
|
| IPAIR | NAME | SHIFT | NEWSHIFT | S/N | NAME | SHIFT | NEWSHIFT | S/N |
| 0 | 03090058 | 0.487891 | 0.00000 | 218.509 | 03090056 | 0.00000 | 0.487891 | 215.836 |
| 1 | 03090057 | 0.487130 | 0.000761002 | 213.119 | 03090063 | 0.00191014 | 0.485981 | 207.920 |
| 2 | 03090062 | 0.486452 | 0.00143898 | 188.583 | 03090059 | 0.00143758 | 0.486453 | 203.315 |
| 3 | 03090061 | 0.486233 | 0.00165799 | 178.441 | 03090060 | 0.000171840 | 0.487719 | 190.281 |