| Red | Green | Blue | |
| z | 17.64 | ||
| znorm | Inf | ||
| sky | -Inf | -Inf | -Inf |
| S/N | 31.0 | 51.7 | 58.4 |
| S/N(c) | 0.0 | 0.0 | 0.0 |
| SN(E/C) |

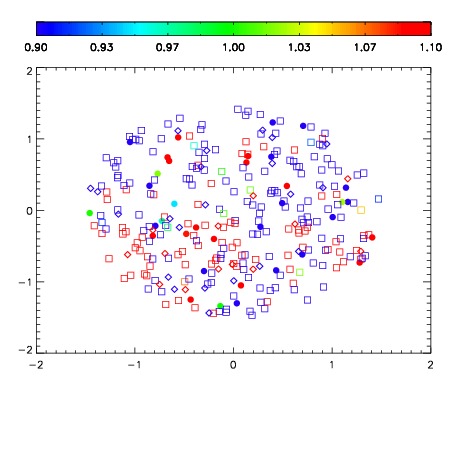
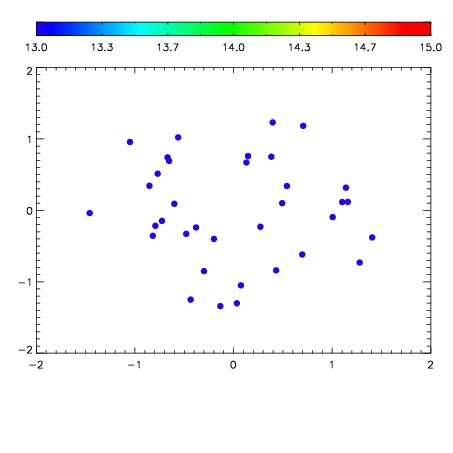

| Frame | Nreads | Zeropoints | Mag plots | Spatial mag deviation | Spatial sky 16325A emission deviations (filled: sky, open: star) | Spatial sky continuum emission | Spatial sky telluric CO2 absorption deviations (filled: H < 10) | |||||||||||||||||||||||
| 0 | 0 |
|
|
|
|
|
|
| IPAIR | NAME | SHIFT | NEWSHIFT | S/N | NAME | SHIFT | NEWSHIFT | S/N |
| 0 | 03710067 | 0.501958 | 0.00000 | 231.288 | 03710068 | 0.00169615 | 0.500262 | 228.773 |
| 1 | 03710071 | 0.501461 | 0.000496984 | 228.869 | 03710069 | -0.000434816 | 0.502393 | 228.644 |
| 2 | 03710066 | 0.496282 | 0.00567600 | 227.658 | 03710072 | -0.000146724 | 0.502105 | 227.985 |
| 3 | 03710070 | 0.500072 | 0.00188601 | 225.435 | 03710065 | 0.00000 | 0.501958 | 226.889 |