| Red | Green | Blue | |
| z | 17.64 | ||
| znorm | Inf | ||
| sky | -Inf | -Inf | -Inf |
| S/N | 29.0 | 50.0 | 59.4 |
| S/N(c) | 0.0 | 0.0 | 0.0 |
| SN(E/C) |
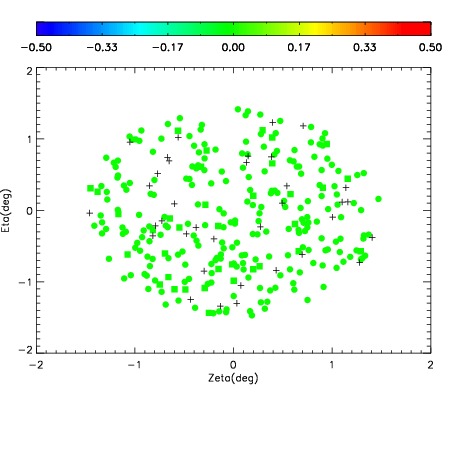
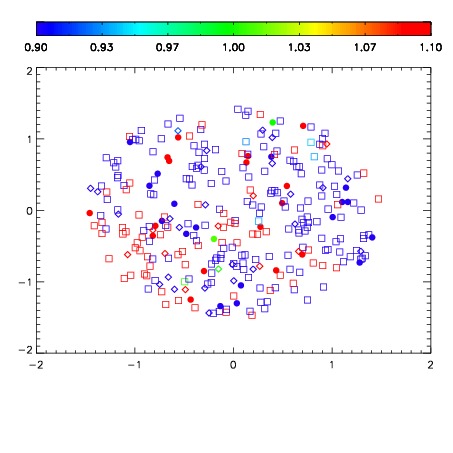
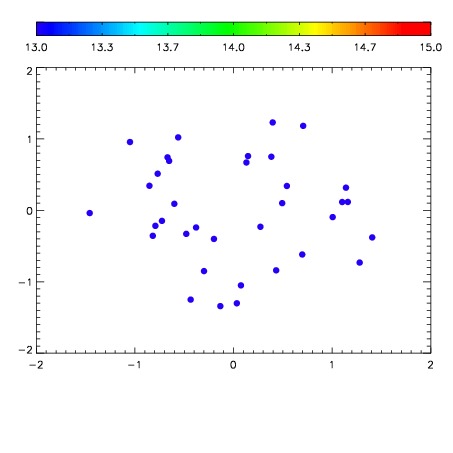

| Frame | Nreads | Zeropoints | Mag plots | Spatial mag deviation | Spatial sky 16325A emission deviations (filled: sky, open: star) | Spatial sky continuum emission | Spatial sky telluric CO2 absorption deviations (filled: H < 10) | |||||||||||||||||||||||
| 0 | 0 |
|
|
|
|
|
|
| IPAIR | NAME | SHIFT | NEWSHIFT | S/N | NAME | SHIFT | NEWSHIFT | S/N |
| 0 | 06730076 | 0.488427 | 0.00000 | 224.336 | 06730077 | -0.000912662 | 0.489340 | 223.918 |
| 1 | 06730075 | 0.486271 | 0.00215602 | 224.883 | 06730074 | 0.00171384 | 0.486713 | 226.709 |
| 2 | 06730071 | 0.483625 | 0.00480202 | 224.621 | 06730070 | 0.00000 | 0.488427 | 225.758 |
| 3 | 06730072 | 0.488374 | 5.30183e-05 | 224.584 | 06730073 | 0.00390727 | 0.484520 | 225.217 |