| Red | Green | Blue | |
| z | 17.64 | ||
| znorm | Inf | ||
| sky | -Inf | -NaN | -Inf |
| S/N | 25.6 | 45.3 | 48.8 |
| S/N(c) | 0.0 | 0.0 | 0.0 |
| SN(E/C) |
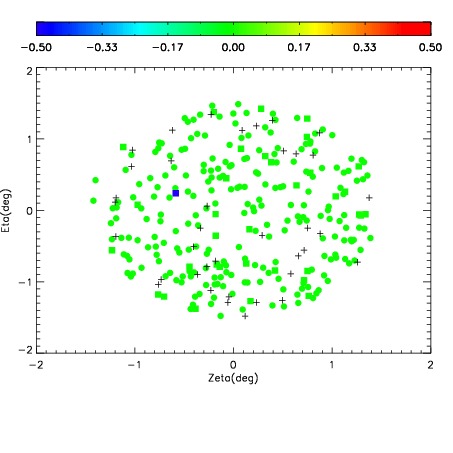

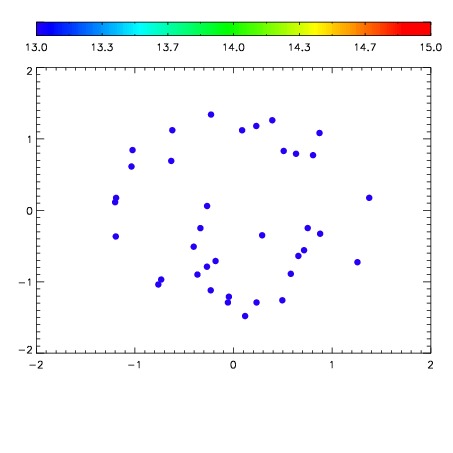

| Frame | Nreads | Zeropoints | Mag plots | Spatial mag deviation | Spatial sky 16325A emission deviations (filled: sky, open: star) | Spatial sky continuum emission | Spatial sky telluric CO2 absorption deviations (filled: H < 10) | |||||||||||||||||||||||
| 0 | 0 |
|
|
|
|
|
|
| IPAIR | NAME | SHIFT | NEWSHIFT | S/N | NAME | SHIFT | NEWSHIFT | S/N |
| 0 | 03980025 | 0.497199 | 0.00000 | 164.642 | 03980027 | 0.00151893 | 0.495680 | 163.449 |
| 1 | 03980028 | 0.495440 | 0.00175899 | 167.633 | 03980026 | 0.00188857 | 0.495310 | 164.988 |
| 2 | 03980029 | 0.494705 | 0.00249401 | 161.884 | 03980023 | 0.00000 | 0.497199 | 162.779 |
| 3 | 03980024 | 0.496185 | 0.00101399 | 160.625 | 03980030 | 0.00127106 | 0.495928 | 161.361 |